


Looking for Low Brokerage, High Margin & Free Tips?
Shooting Star Pattern
| | Chart Patterns | No Comments
More Chart Patterns
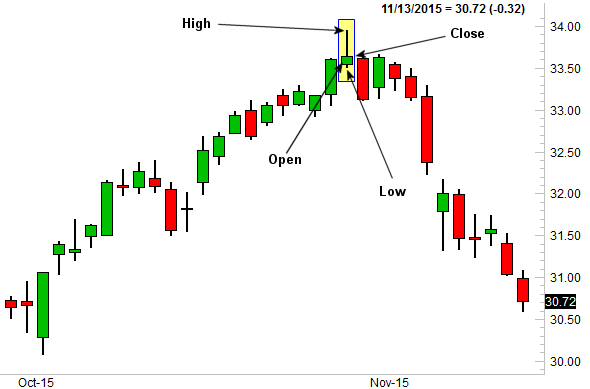
Shooting Star Pattern is referred to as a bearish candlestick with a long upper shadow and a small lower shadow or no shadow at all. Its real body spotted at the day’s low is usually small. The shooting star candlestick appears right after an uptrend or a bullish trend.
This candlestick pattern formation happens when the price of a security rises higher than its initial price, but reduces to value even lower than its opening price at the close of the day.
Investors check to see if the distance between the highest price during the day and the initial price is twice as much as the body of the shooting star. Further, the distance that exists between the closing price and the lowest price for a day is either insignificant or not present at all.
Shooting Star Pattern Meaning
When you read the term ‘Shooting Star’, what is the first thing that comes to your mind?
Of course, a star that was all high and up there in the sky and is suddenly falling on earth or maybe getting faded before it even touches the earth surface.
A shooting star pattern is no different. When the trading session opens, a stock opens pretty high and stays up all day long but then, comes down to its opening price when the trading session is about to be closed for the day.
So what happened there?
Bulls beating bears and then the vice-versa happening?
Well, more or less, yes! But you cannot take any trading call based on that trend. It is suggested that you wait for the next trading session to open and see how it reacts.
If the stock continues to dip, it makes total sense to short the stock for a bit. All this is applicable as long as you are placing an intraday trade. Make sure you remember that!
Shooting Star Pattern Formation
The shooting star pattern sometimes looks like an inverted hammer candlestick pattern. To find the difference between the two, the price direction before the creation of the candle is observed.
The shooting star candle marks the point after which a trend reversal may happen following a bullish uptrend. When traders spot a shooting star pattern, they embark on short trades with the assumption that the bullish trend may not continue for long.
The shooting star depicts rapid participation of the bulls, accompanied by price rise, and this trend diminishes to lower the prices considerably.
Price tops and price reversals are indicated by shooting stars. The shooting star candlestick is significant for a trader when its formation is spotted after three or more than three rising candles arranged in succession with higher highs.
A rise in the prices encourages buyers to wait until a pullback appears to mark the purchase of their chosen financial instrument.
Learn more: Pullback Meaning
Early buyers end up with a large share of profits.
As short sellers enter, the prices start to drop after hitting their peak. At the close, the candle is accompanied by a shadow or a wick which measures approximately twice its body. The shadow represents buyers at a time when the liquidity is starting to diminish.
When the candle following the shooting star does not make a higher high and advances for a close right under the close of its previous candle, the pattern confirms the presence of a shooting star.
Shooting Star Pattern Confirmation
Prior to starting trade with a shooting star pattern, you must first confirm it. That is to say, an active bullish trend must be present and the candle must have a small body and big upper wick.
Thereafter, a trader must wait for a second signal and a bearish candle must be present in the form of a break for the low point of the shooting star body.
All these signals confirm that a shooting star candlestick is actually present on the trend line chart and predicts a price move towards a bearish trend.
Trading the shooting star candles requires the use of stop loss order. False signals may appear during trading and the shooting star pattern must be placed above the pattern’s upper wick.
The size of the pattern determines its price target. For a trader, the identification of this pattern generally leads to the selling of the security.
In short, the traders sell a security when a bullish trend and shooting star candles are spotted, followed by a bearish candle. The stop-loss occurs above the upper wick of the shooting star.
This short trade can be continued until the bearish price reaches a value which is three times the size of the shooting star candle with its upper and lower wick combined. A win-loss ratio of 3:1 may be realized by using such a shooting star strategy for trading.
Shooting Star Pattern Example
Let’s take a quick example to understand this pattern in a more realistic manner.
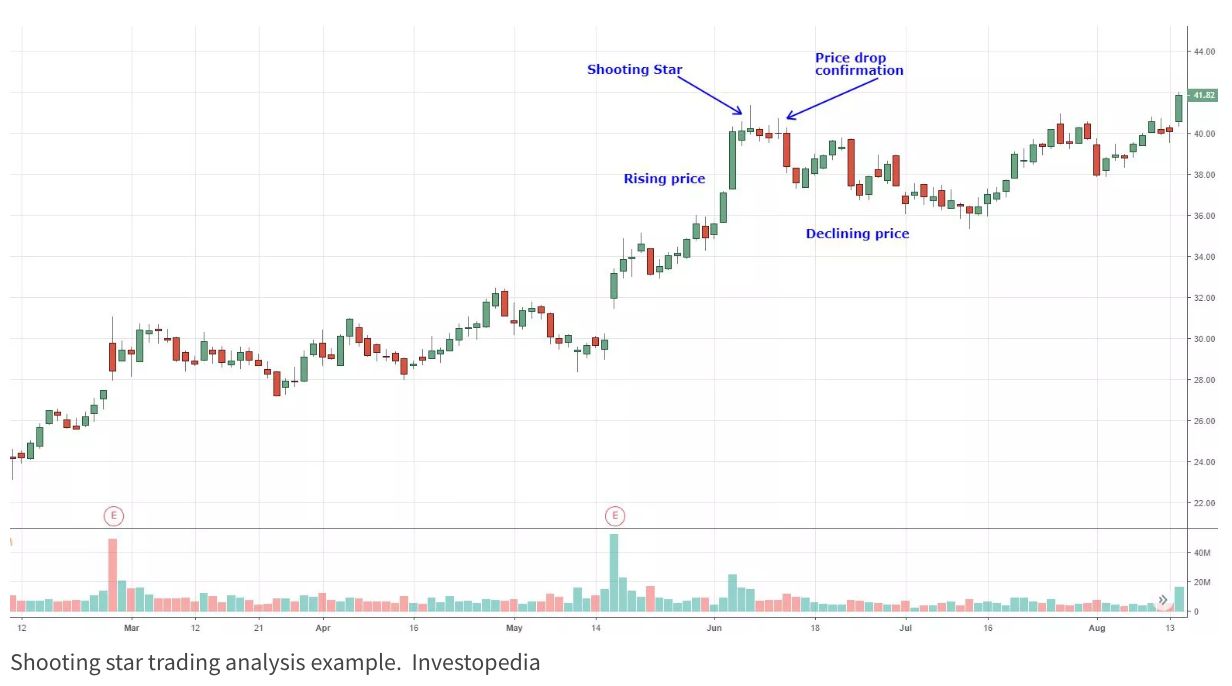
Here is a snapshot of a market trend:
In the trend above, you need to closely see that the stock being monitored here opened and then jumped pretty quickly in an uptrend. It stayed high for the most part of the trading session but then closed around the same price as it opened in the morning.
This implied that the stock saw a downtrend towards the later part of the day.
To observe how the stock is going to fare the next day, it can be seen from this image above that the stock continued to go down. This implies that the bears had complete control over the stock and were pushing the price of the stock even down than the previous day.
Now, how would you react to such a trend?
Well, most traders, post confirmation of a shooting star trend, exit their long positions and a few actually go short on that stock for a short period.
Shooting Star Pattern in Uptrend
Well, as explained above, the shooting star pattern sees an uptrend for a short while in its formation. Post that, it sees a decline in the stock price.
The interesting part is that if this trend is confirmed, then this decline in the stock price continues even in the next trading session.
An uptrend is crucial for a shooting star because this is the trend its formation actually pans out from.
Shooting Star Pattern Trading
Traders can make use of the shooting star pattern to derive an advantage in a number of ways.
They may enter the market at the point of high entry. Selling at such a turn of events may mean that you may be trading at an improved risk-reward ratio. However, in this case, several other opportunities may be missed.
The other option is to make a fast entry for the possibility of enjoying several other trading opportunities at a reasonable risk-reward ratio. However, a confirmation is not available before a position is open.
Other entry positions are the simple confirmation entry and the double confirmation entry. In the case of simple confirmation entry, selling happens only at the close of the market at a point below the low of a shooting star.
This position implies that a trader waits for a confirmation signal before trading. However, the reliability of such a signal is questionable. In double confirmation entry, the first low from the shooting star is looked for in order to start selling.
In this way, a more solid reversal confirmation is warranted. However, the risk-reward ratio is much worse, the stop price is much higher, and profit level is much closer.
In conclusion, the shooting star pattern is an important reversal pattern to ascertain the right time for selling securities. However, several accompanying signals must be studied to ensure that your final decision is profitable. Besides, stock traders have a number of options to choose from when it comes to picking the right time to deal in securities.
In case you are thinking of getting started with stock market investments or trading, let us assist you in taking the next steps forward:
More on Share Market Education
In case you are looking to learn more about Chart Patterns, here are some reference articles for you:
Summary
Reviewer
A Digital Blogger
Date
Broker Name
Shooting Star Pattern
Overall Rating
