


Looking for Low Brokerage, High Margin & Free Tips?
Hanging Man Pattern
| | Chart Patterns | No Comments
More Chart Patterns
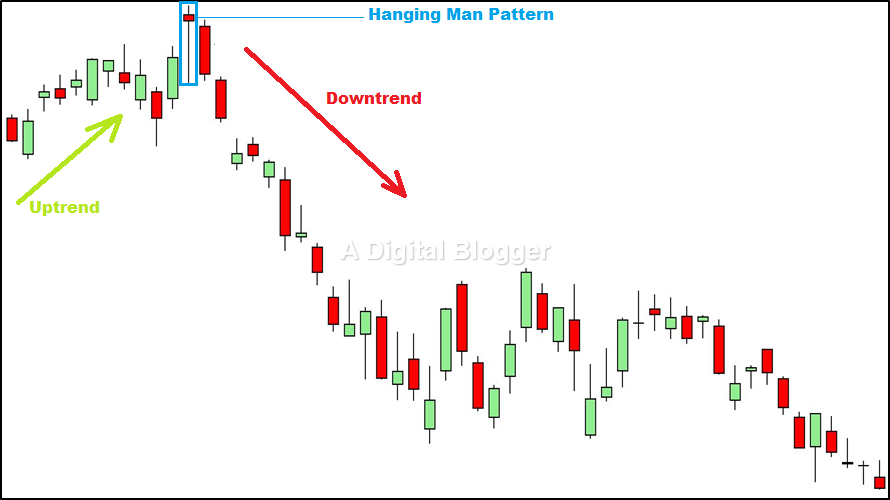
Hanging man pattern is composed of a single candle. This single candle forms part of an uptrend featuring prices for financial securities.
This pattern happens when the market sees lots of investors dumping stock in the early part of the day and then buyers seeing it as a buying opportunity on a parallel basis. This action-reaction brings the stock price back to the range of the opening price for the day.
But what does it signify for an intraday trader? Is it a panic situation or just a passe!
Let’s learn more about this candlestick pattern in this detailed review along with the help of relevant examples.
Hanging Man Pattern Meaning
Candlesticks are important technical indicators of investor sentiments when it comes to the price of securities. They are used by stock traders to understand when it is the right time to enter and exit a specific trading opportunity.
This pattern is indicative of a trend reversal after an upward trend. It is a sign of change in the market sentiment and indicates a loss of strength of the buyers in the presence of an uptrend.
In the share market, when demand pushes the prices higher, the selling activity increases. Buyers try to pull the prices back to their original opening value, but investors perceive a peak in the stock prices. The hanging man pattern occurs when an uptrend is characteristic of an asset.
The candlestick shown in a hanging man pattern has a very small body. This means that the distance between its open and close is very less. It has a long lower shadow and its upper shadow is absent.
In a hanging man candlestick pattern, its lower shadow must be at least twice the length of its body. Selling based on the hanging man pattern may prove risky for a typical trader.
However, this pattern may serve as an opportunity to sell existing long positions or even short positions, with the expectation that the prices are about to decline.
Using the Hanging Man Pattern
Investors look for specific characteristic features in hanging man patterns and take advantage of the prevailing market sentiment. It is important to check whether it is at least twice as long as the body.
A long lower shadow is an indication that sellers entered the market space aggressively when the formation of the candle took place. A long lower shadow adds more meaning to the hanging man candlestick pattern.
Hanging man candlestick patterns with long shadows have been observed to perform better than those with shorter shadows.
Furthermore, candlesticks featuring a heavier trading volume, as opposed to lower volume, serve as predictors for price movement towards a lower point. A confirmation candle on the day after the appearance of a hanging man candle is another important feature to look out for.
The interpretation of a hanging man is inherently a price drop and this can be confirmed by looking at a price drop during the next day. Although the size of the Hanging man candlestick matters for effective stock trading, the colour of the candlestick is not significant to derive viable conclusions.
Traders may look for hanging man patterns with elongated lower shadows and above-average volumes to make a prudent trading move.
When these patterns are followed by another day or time frame of selling with a chance of prices lowering, even more, the odds in favour of successful trading are even higher.
Upon witnessing such a pattern, a short trade is recommended near either the closing price of the hanging man or close to the open of the next candle. A stop-loss order could be placed above the high point of the hanging man candlestick.
It is important to note that hanging man patterns must be perceived as reversal signals for a short-term only. While trade must resume as long as the downward momentum prevails, it is only advisable to stop trading as prices start to rise.
Again, here is a quick summary of how to identify a hanging man pattern formation:
- The body length must be close to half the size of the upper shadow.
- There is no implication as far as the colour of the body is concerned, however, the real body must be on the upper side of the trading range.
- Next day, ideally, the closing price must be with a gap down.
Hanging Man Pattern in Uptrend
This needs to be always remembered that the hanging man pattern is a sign. It’s a sign that you cannot just trust the trend based on what sellers are doing.
If sellers are exiting their positions, correspondingly buyers are seeing an opportunity as well.
However, when a hanging man pattern forms in an uptrend, it throws one strong signal – Buyers are letting it go! When there is a lot of selling happening at the onset, the sellers are invariably thinking (hopefully based on analysis) that the stock has seen its highest price point.
In such a case, you may choose to get out of your existing positions that you had gone long for. A few traders might actually start shorting on the stock as well assuming the price is only going to see a decline for a bit.
Hanging Man Pattern Example
Although it happens rarely, but yes Hanging man pattern does appear in Nifty.
For instance, recently in July, the Nifty index opened at 11,890.30 but then was found reeling at an intraday low of 11,814.70.
In the latter part of the day, the index gained through an uptrend and touched a high of 11,917.45 before it finally closed at 11,910.30.
All this behaviour resulted in the formation of a hanging man pattern. Thus, always be wary of the different considerations since such trend formations may result in quick money-making opportunities for intelligent traders.
Hanging Man Pattern Success Rate
Like in the case of any other candlestick pattern, if you are going to use the Hanging man pattern in isolation, the success rate is not going to be very high.
Having said that, if you use multiple patterns together, it may lead to confusion and thus, loss in your trade.
Therefore, in order to get a high success rate while using the hanging man pattern, you are advised to use a few complementary patterns along with it. Furthermore, if the pattern used is bearish in nature, the success rate may go definitely higher.
Hanging Man Pattern Reliability
The hanging man pattern is considered to possess a low degree of reliability. Certain aspects serve as good predictors for falling prices after a hanging man pattern.
As mentioned earlier, when the hanging man pattern is accompanied by favourable figures such as volume and lower shadow, it becomes a more viable predictor of lowering prices.
Investors must ensure that trading takes place only when strong patterns are witnessed.
The hanging man pattern must not be confused with a shooting star pattern. While both shooting stars and hanging man have small real bodies, the former has a long upper shadow and the latter has a long lower shadow.
Furthermore, it is important to differentiate between the hanging man and the hammer. Although both candlestick patterns are precursors to trend reversals, the nature of each of these arrangements is very different. When the candlestick pattern is part of an upward trend which leads to a bearish reversal, it is most probably a hanging man pattern.
On the other hand, when the candlestick pattern is part of a downward trend leading to a bullish reversal, the arrangement is most likely a hammer candlestick.
As a final thought, the utilization of favourable characteristics, and the assignment of a stop-loss value above the hanging man are important measures to eliminate the low confidence level associated with the stock market prediction accuracy of stock trading with the hanging man pattern.
If you are sceptical on how to go about stock market trading or looking for a reliable demat account, let us assist you with the steps ahead:
More on Share Market Education
In case you are looking to learn more about Chart Patterns, here are some reference articles for you:
Summary
Reviewer
A Digital Blogger
Date
Broker Name
Hanging Man Pattern
Overall Rating
