


Looking for Low Brokerage, High Margin & Free Tips?
Rounding Bottom Pattern
More Chart Patterns
Rounding bottom pattern shows long-term reversal and is more suitable for weekly charts. Traders may sometimes call it the saucer bottom pattern. You may see a bearish bias convert into a bullish bias over a long consolidation period. The weekly chart is most suited for the rounding bottom pattern as it has a longer consolidation period.
Rounding Bottom Pattern Formation
This pattern, like any other charting pattern, has its own journey from where it gets initiated till the time it gets completely formed and is visible to traders and investors. Let’s quickly try to understand how the whole chart candlestick pattern formation takes place.
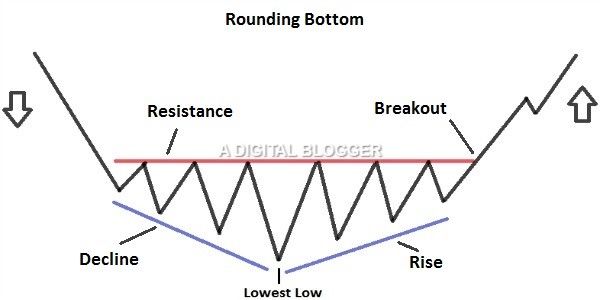
The Declining Formation
A prior trend precedes the pattern which undergoes a reversal. The low point of the rounding bottom pattern shows a reaction based low. This low point does not always form at the same time as observing the rest of the pattern.
It may be recorded many months prior to the pattern formation until security trading falls flat just before the pattern formation. At the time when the pattern forms, the low of the pattern may not necessarily be its lowest low during the last few months. At the beginning of the pattern, there is a declining trend leading to the low of the pattern.
The declining trend sometimes has a series of reaction highs and lows, giving it a jagged appearance. Sometimes, a linear trend is likely to occur.
The Advancing Trend
The right half of the trend pattern shows data on advancing candlesticks and is roughly similar to the declining pattern preceding it.
In case of a sharp advance in the second half of the curve, the pattern may not necessarily be the rounding bottom pattern. When the pattern breaks above the first reaction high, just before the decline of the pattern, it reflects a bullish confirmation.
This pattern is similar to other resistance breakouts, and the level of the breakout acts as its support.
Volume levels in the entire trend define the shape of the rounding bottom pattern. This means that a high volume accounts for the beginning of the declining trend. The end of the decline indicates low volume, and the rest of the trend shows a rising trend on account of a gradual increase in the volume.
The breakout also depicts a rise in volume.
Similarity with other Patterns
The rounding bottom pattern is similar to the head and shoulders bottom pattern in some respects, in the sense that it shows the head but not the shoulders. The low of the pattern corresponds to the head of the pattern and shoulders formation as the head lies at the centre of the pattern.
Other similarities exist in terms of the distribution of the volume, on the declining trend and the advancing trend. Volume levels at the resistance breakout also change in a way similar to the head and shoulders bottom pattern.
The rounding bottom pattern is different from the inverted head and shoulders pattern as its bottom appears in the form of a saucer, develops gradually over a long time, and therefore, does not seem to be V-shaped at its bottom.
The saucer bottom and half-pipe bottom also bear some resemblance to the rounding bottom pattern. In the cup and handle pattern, a slight decrease just before the breakout is observed.
Rounding Bottom Pattern Trading
The rounding bottom pattern is ideal for someone who is looking at long-term profits.
Investors who are able to exercise patience do well with this pattern, as it may take time to develop prior to a change in prices. In the declining left-half of the pattern, a slow rate of decline is observed. After the turndown, there is often a gradual increase in the area of bullish momentum.
As a result of this rate of change, a trader frequently finds symmetry on the left and right side of the pattern formation. The gradual change from bearish to bullish sentiment takes up much time.
A price shift from the bearish trend to a bullish trend is characteristic to the rounded bottom pattern. Its volume indicator is its strongest confirmation. The rounding bottom pattern is rare but has a high rate of success.
To successfully trade with the rounding bottom pattern, a trader first identifies the pattern and then draws the neckline. The next step is to confirm the bottom breakout.
The best way to enter it is with the long trade at the breakout. The trader then places a stop-loss in the middle of the pattern. A trader may choose to stay in the specific price move for a time equal to its size.
Validating the Pattern
The pattern can be easily validated using its volume. High volume at the start, followed by a gradual decline, and the consolidation of stock towards a bullish bias is all part of the rounding bottom pattern.
The pattern is generally assessed by drawing a line connecting the top part of the volume levels for every price shown in the candlestick representation.
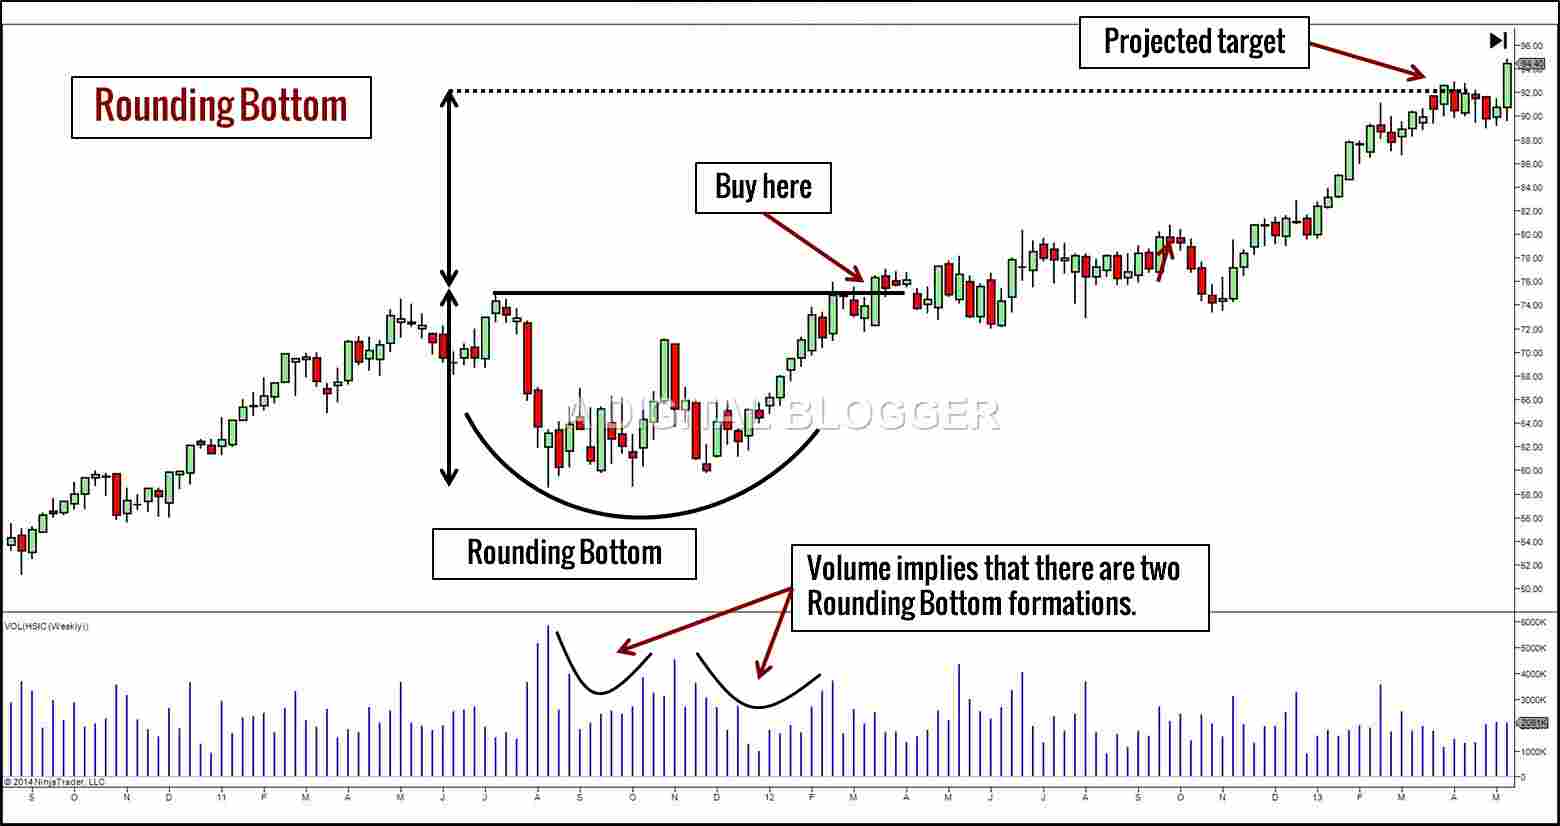
Finding the Profit Target
Traders mostly expect the pattern to show a bullish sentiment succeeding a bearish trend. This means that traders and analysts expect prices to reach new highs. Setting the profit target is all about finding out how far you want to go to reach a new high.
This move must roughly be equal to the size of the formation of the rounding bottom.
To find your profit target, your first step is to find where the neckline of the pattern is located. A good idea to get this right is to draw a line at the top of the bearish trend, and then at the top of the bullish trend prior to the breakout.
Later on, the distance measured between the lowest point of the rounding bottom pattern and the neckline of the rounding bottom pattern is its size. When the neckline breaks, it is safe to open a long position. Overall, the rounding bottom pattern has a high success rate.
Several other trading strategies are used with the rounding bottom pattern. It is possible to execute a powerful trading strategy using the flat pattern spanning several months and leading to the rounding turn.
The best performance can be expected from a pattern accompanied by a breakout that occurs within one-third of the yearly high. In the rounding bottom pattern formation, a throwback may hurt the performance after the break out occurs.
Trading Success
Two important factors behind the good performance of rounding bottom patterns are its large average rise and its small break-even performance rank.
Technical analysts estimate that its break-even failure rate is only 5%, and its throwback rate is 40% in a bull dominant market.
Its overall performance comes to 5 out of 23, which one being the best, on the basis of hundreds of perfect trade scenarios.
Rounding Bottom Pattern Conclusion
In conclusion, the rounded bottom pattern can occur as a continuous or a reversal pattern.
The pattern transfers control from the sellers to the buyers. At times, traders may even encounter a rounded bottom reversal signal, which mainly depicts close of a downtrend and rise in prices. At the point where the prices level off, a small double bottom pattern may be formed, or it may even give rise to a triple bottom or head and shoulders pattern.
This pattern allows the trader to vary the entry point and the location of stop-loss. To ensure a high reward-to-risk ratio to the extent of 4:1, a trader may start buying as the price goes higher, a good place to stop-loss below a recent low.
If a trader chooses to wait until a traditional breakout occurs, it is a good idea to place a stop loss below the low of the pattern. In this case, the reward-to-risk ratio could be estimated at 1:1.
In case you are looking to get started with using such trading chart patterns or generic stock market investments, let us assist you in taking the next steps ahead:
More on Share Market Education
In case you are looking to learn more about Chart Patterns, here are some reference articles for you:
Summary
Reviewer
A Digital Blogger
Date
Broker Name
Rounding Bottom Pattern
Overall Rating
