


Looking for Low Brokerage, High Margin & Free Tips?
Ascending Triangle Pattern
| | Chart Patterns | No Comments
More Chart Patterns
The ascending triangle pattern is characteristic to an uptrend and forms as a continuous pattern. The ascending triangle pattern is far from a symmetrical triangle, in a bull-dominated market space. This means that the ascending triangle pattern is not a neutral pattern by any standards.
Let’s learn how to identify an ascending triangle pattern in your day to day trades and what are some of the best ways to trade using such a pattern.
Ascending Triangle Pattern Meaning
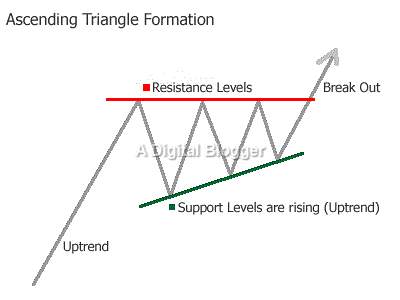
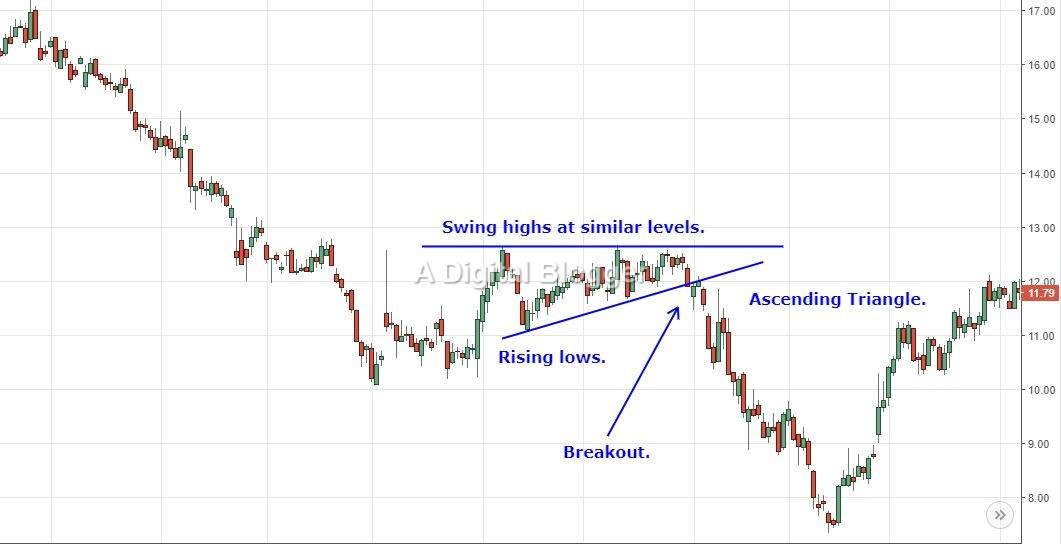
The ascending triangle pattern forms as a right-angled triangle. The primary aspect that you may look for in candlestick chart types is to spot an ascending triangle pattern is whether it has two or more equal highs. These equal highs depict the imaginary horizontal line. As you move further, you are likely to come across two or more rising troughs connecting an ascending line.
The next step is to imagine extending the top horizontal line, which forms the base of the right-angled triangle.
The ascending trend line may also be extended so that it resembles the slope, which is the hypotenuse of the right-angled triangle. To complete the triangle, you are simply assuming a perpendicular line extending down from the left endpoint of the horizontal line, all the way to the slope of the right-angled triangle.
Ascending Triangle in Uptrend
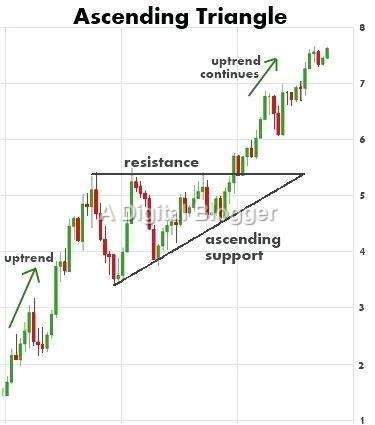
As the name suggests, the ascending triangle pattern is generally recognized with a potential uptrend in the market price. In fact, this uptrend is only going to complete the formation of this pattern.
Although, the bears will try to take the market down, implying the sellers will try to pull the price low, however, if this patter is in route to be formed, that is not going to happen.
Think of a spring that gains momentum every time it hits the ground. With the same logic, the high price point is going to be marginally better than the previous jump each time the sellers make an attempt to pull it down.
Ascending Triangle in Downtrend
The rule in an ascending triangle pattern is simple!
Long when it goes bullish, short when it goes bearish. Simple, right? Told ya!
Thus, although this pattern is all about uptrend and the market being bullish, the sellers will make their respective attempts to bring the pattern towards a downtrend. However, the bulls will take the control back the move the price up but of course, the downtrend is, invariably, the part of the overall pattern formation.
If you observe the consistency in these formations, then although it is a bit far-fetched, you may be ready for the next formation to be coming in place and make your trade by going short when the downtrend is about to hit the pattern. Obviously, your trade exit has to be pretty quick as well in such a case.
Ascending Triangle Breakout
Since the pattern includes both downtrends as well as uptrends to happen to complete its formation, there is an equal chance that the breakout may happen in either direction.
You can take a cue from the fact that whenever the breakout occurs, the impacted traders are very likely to place their buy or sell trades in a go. The choice of buy or sell depends on the direction in which the breakout occurs.
This jump in volume turnover is your sign that well, the breakout has started!
Having said that, you need to observe the strength of the breakout as well. Some times, it could be a weak one where a few sellers or buyers looking at a quick movement, in their nervousness, join the bandwagon. But this point cannot be termed as a breakout since it is never a strong point and the pattern gets back to its shape pretty much quickly.
Lastly, if you find your trade as part of such a pattern – if the breakout is happening in an uptrend – buy else sell.
Ascending Triangle Pattern Stocks
Even though it is rather obvious to spot the ascending triangle pattern, there are some good to know aspects as well.
First, it is possible that these patterns form as reversal patterns when a downtrend is about to end. Although this is an exception, the formation is still a possibility.
Another significant aspect of the pattern is the presence of an established trend. Given that the pattern is bullish; your primary task is to discern a robust formation. It may not necessarily be as important to accurately understand the specifics of its duration and length.
Reaction highs showing fluctuations for securities are revealed in the typical candlestick chart pattern. When demand and supply patterns for securities undergo changes during trading, you are likely to see spikes and troughs now and then.
The goal here is to spot two such reaction highs to visualize where you are to place the top horizontal line in the right-angled triangle. The highs are usually located close together and generally a few measurements above or below one another.
The other confirming aspect of two reaction highs is a reaction low in between them.
A reaction low is visible as a trough during security price fluctuations. When the criteria for the price movement and time intervals is already known, it is easy to spot an intermittent reaction low which serves as a confirmation for selecting two specific peaks that define your horizontal line.
The lower ascending line connects the two reaction lows and extends higher in the same direction. The reaction lows generally gain height as the pattern moves further. If you spot a reaction low, roughly equal to or less than the previous formation, then the ascending triangle may not necessarily be a valid one.
Ascending Triangle Pattern Trading
Duration, Volume, and Target in an Ascending Triangle Pattern
Although the duration may not necessarily be as important as the robustness of the pattern, the length of the pattern is essential. A pattern which spans a few weeks or months is ideal for the purpose. The average length of the pattern is anywhere between one and three months.
A noteworthy feature of the ascending triangle pattern is the successive decrease in the volume of stock as the pattern advances. An upside breakout always occurs with an increase in volume, and this also serves as a breakout confirmation. However, although volume expansion is a key aspect of identifying the pattern, it may not always happen.
As is the case with all other patterns in technical analysis, the ascending pattern is also characterized by resistance switching over to support as a break in the horizontal line is observed.
When the breakout occurs, the target is easily established. Just after the breakout, you can easily measure the price projection, which is the widest distance of the pattern applied to the resistance breakout.
The Rationale behind the Ascending Triangle Pattern
The ascending triangle pattern has a characteristic top horizontal line which corresponds to overhead supply and is the resistance that does not allow certain security to move beyond the limit set by this level. The price does not rise, but the reaction lows continue to rise to form the hypotenuse of the right-angled triangle.
The higher lows show that buying pressure has increased and the ascending triangle pattern gets a bullish bias.
The pattern is a clear signal of a market going higher as higher lows form a series heading for the resistance line. Traders may take this as a sign of strength with buyers willing to pay more. This is why successive higher lows seem to advance toward the resistance line.
The higher lows forming as a series in the pattern also clearly show that demand is still a feature of the current market scenario even in spite of the high prices.
It may also be possible that selling pressure is minimal in a scenario that helps in pattern formation. When the selling pressure increases in size, the price will not stay at the resistance level for a long period and moves down quickly.
In the case of an ascending triangle pattern, the price stays at the resistance level for a long time, giving a clear sign of a lack of selling pressure.
You may also see a cluster of buy stop orders above the resistance line. When the price re-tests resistance, more traders are likely to place their stop-loss over the resistance line. In the case when the market breaks out at a higher level, the stop-loss orders are triggered and the prices advance even further.
An important consideration while trading with the ascending triangle pattern is that shorting may not necessarily be the strategy that benefits you when it reaches the resistance level. This is because the way a price approaches a resistance level determines whether shorting is the right move.
The higher lows advancing towards resistance indicates strength in the market conditions. When the market breaks at a higher level, it only makes sense to abstain from shorting.
Market Entry Strategies
That said, your concern at this point may most probably be related to determining the best time for your entry. You may use either the stop order, trend line re-test, or break and close to find the best time for entering the market.
In the stop order approach, price trading above the highs requires a strategy to go long. In the case of a real breakout, this price may prove ideal for entering the market. The only concern here is to watch out for false breakouts.
The other approach is the break and close approach which requires you to wait until a price break and close occur above the high. A prudent market trader will likely choose to go long at this point. This confirmation is necessary to rule out a false breakout. Further, if there is strength in momentum, you may enter a trade at a higher price value.
The third approach is to go long for the time the price re-tests the trend line at the so-called hypotenuse. This indicates a favourable risk-reward ratio in the case of a market breakout. However, there is no assurance that the market will break out, in which case, you may not make the expected profits.
An important consideration while trading is to find out where you are to place the stop-loss. Your stop-loss site is usually at the place which may show the invalidating of your market set up in the case when the trend line reaches this spot.
Market Exit Strategies
The other key aspect in this context is to find when to exit the trading space with most profits. After you have successfully identified the ascending triangle pattern and the breakout, and the market movement is as expected, your next step is to follow a practical exit strategy.
The first strategy is the trailing stop-loss using the moving average method. When you go long, the best way to trail stop-loss is by applying the 50-period moving average. In other words, you stay in the same position until a market break happens and closes below the 50-period moving average.
However, you may not always need to use the 50-point average. This is not a fixed measure and you may either use the 200-period moving average for long-term trends, or the 20-point moving average for short-term trends.
Price projection is another key market exit strategy which determines the point at which the price will exhaust itself. Using this approach, you find the width of the ascending triangle from its high to it’s low and then add this value to the breakout level. This is your price projection.
However, when using price projections, you are able to reach your target profit, but by risking a sudden reversal trend. When the reverse happens, you are likely to hit your stop-loss.
Therefore, an ideal recommended strategy combines the two approaches. When the market advances according to your expectations, but the desired price projection level is not reached, the moving average helps secure open profits. This works best in the case of a sudden reversal as well, since the profits you earned still stay with you.
To sum it all up, the ascending triangle pattern is a powerful chart pattern and your stop-loss strategy determines how well you are likely to do with the pattern.
While a range of entry strategies are suitable, such as break and close, stop order, and re-test of the trend line, the exit strategy is equally important to finding your overall success and profitability in the market.
In case you are looking to get started with using such trading chart patterns or generic stock market investments, let us assist you in taking the next steps ahead:
More on Share Market Education
In case you are looking to learn more about Chart Patterns, here are some reference articles for you:
Summary
Reviewer
A Digital Blogger
Date
Broker Name
Ascending Triangle Pattern
Overall Rating
