


Looking for Low Brokerage, High Margin & Free Tips?
Dragonfly Doji
| | Chart Patterns | No Comments
More Chart Patterns
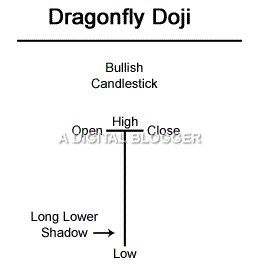
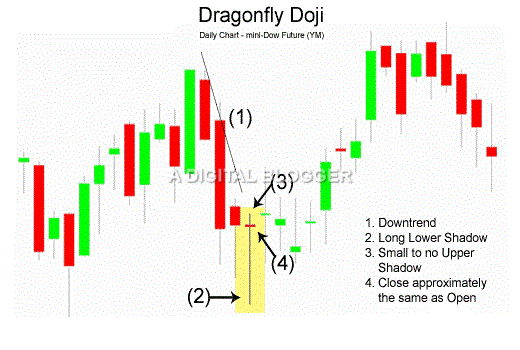
Dragonfly doji bullish reversal pattern is often found at the bottom of downtrends. The dragonfly dojis’ lower shadow is clearly longer, and it has no upper shadow. This pattern forms open, close, and high data points at about the same level.
The extreme top of the dragonfly doji marks the open and close points. An important identification of the dragonfly doji is its long lower shadow. The long lower shadow shows where the demand prevails in the market.
In terms of the war between bears and bulls, the trend shows an ineffective attempt by the bears towards pushing prices down, the presence of a support area, and upward momentum of prices that caused them to reach the opening price.
Sometimes, a dragonfly doji may be seen as part of a downtrend, indicating buying power of the market. But most of the time, a trend reversal is a common stock market prediction with a bullish dominance. In short, the trend clearly shows the victory of the bulls.
Dragonfly Doji Meaning
Indecision and trend reversal are indicators of the Dragonfly Doji.
The T-shape is a clear characteristic of the dragonfly doji as it forms when a trading day shows a downtrend, reversal, and close near the opening price. In general, the body of the candlestick shows the range between the opening and closing price.
Wicks or shadows are the highs and lows that occur during the day. In this context, the Dragonfly Doji shows the same value for the daily high price, the opening, and the closing.
This pattern represents a market trading with a downward momentum, followed by a reversal.
However, the market is unable to move beyond the opening price. Price reversal is only to the extent that it makes it in time for the daily opening value. The trend may form on account of a number of reasons. One reason is that the investors were neutral, with a low-level of confidence about expecting upward momentum.
The dragonfly doji is very similar to the hammer candlestick pattern and the long-legged doji patterns. The key difference between the dragonfly doji and the long-legged doji is that the upper shadow is apparent in the long-legged doji.
The difference between the hammer and the dragonfly doji is with respect to the opening and closing data points for prices. Considering these important differences helps traders accurately determine whether they spotted the correct dragonfly doji.
Dragonfly Doji Pattern
A dragonfly doji may indicate a position in the candlestick trend where a probable reversal is possible.
When a trader can suitably recognize the dragonfly doji position, it prepares the ground to enter and exit the market at the right time. Similar to other candlestick patterns, trading with the Dragonfly Doji is most successful when you are able to see a confirmation in the nearby candles.
For example, if you see a dragonfly doji close to some support level, with its lower shadow located outside the Bollinger band, the position most likely indicates eager buyers, and this trading position is significant. At times, you may also spot a large lower shadow outside the Bollinger band, and this may show an important bottom, especially when the close of the stock lies within the band.
When a downtrend exists at the start of the trading activity, the supply is more than demand. In response, the prices may fall. Over time, due to a sustained increase in demand, the supply and demand forces are equal. In this case, the price reaches a low point for that day.
Such a change in the trend is there to last, and the demand gradually surpasses supply in the market. A rise in price is to the extent that its close coincides with the opening.
The initial supply and demand are close together at the high data point when the session ends. At this point in the trading activity, it is not recommended for traders to resume buying. Confirmation of a continuing trend is desirable.
One strategy is to wait and see how price moves the next day. If you see a white candlestick, it is only advised to buy above the high data point for the day when you see the confirmation of a change in the trend.
In this case, it also helps to place a stop-loss for a sell order lower than the low data point of the downtrend.
If you are looking at entering the market at an early stage on the day after the appearance of the dragonfly doji, it is good to verify if the market opens above the high data point of the doji. When this happens, a trader is in a safe position to immediately start buying.
In other cases, when the market opens at the high data point or just below it, then the buying activity it safe to take place above the high data point when the price crosses it. In this case, the trader may assume a stop-loss below the low.
Dragonfly Doji Confirmation
Let’s quickly asset some of the specific aspects related to Dragonfly Doji that can directly assist you in capturing profits in your stock market trades:
Significance of the Dragonfly Doji
All dojis indicate weakness in the market and an impending trend reversal. The reversal could be either bearish or bullish. The location of reversal depends on where exactly a doji candlestick appears on an elaborate chart.
A doji is most significant when it is close to an area of resistance or support, or in an overbought or oversold market. Besides, a single doji has more significance when compared to multiple dojis in a trend line.
Reliability of the Dragonfly Doji
When you see a dragonfly doji at a buy at the bottom of a downtrend, it shows greater reliability about the likelihood of a trend reversal. Analysts believe that the dragonfly doji shows a trend reversal only 50% of the time.
In effect, the dragonfly doji may not act as a reversal or a continuation candlestick. The possibility of an upward breakout is very high due to the position of the open and close price.
After a downward breakout, when the market is bearish, a decline of only 5.02% may be expected. By looking at a 10-day performance, the best scenario is a downward breakout when the sentiment is bullish. A bearish sentiment does not often act as the right catalyst for optimal performance of the dragonfly doji candlestick.
Dragonfly Doji in Uptrend
Generally, if the market or any specific stock is in an uptrend, it is believed to be a positive sign. However, when the trend is seen through a dragonfly doji pattern, it may not always be a 100% positive sentiment.
It may actually imply indecision in the market where neither the bulls nor the bears have any clue about the direction the market or the stock is going to go.
Thus, you are advised to keep a close eye on the next candlestick in the chart and objectively understand the market movement before guessing anything in this confusing trend.
Dragonfly Doji at Bottom
This is where it gets interesting (and profitable!). When the price hits the bottom part of the downtrend, then you can expect that the market may bring a reversal. That is what Dragonfly pattern is going to indicate you anyway.
The logic behind this is simple!
In such a pattern, when the market price hits a support level low price, then this sends a signal that the seller traders are now being outnumbered by buyer traders as they the bears are not able to take the price of the stock any lower.
This is a good time to enter the market.
However, if you are looking to play even safer, then you can wait for the next day market opening and in case the stock opens higher than the last day’s closing price – that is a sure shot signal for you. Buyers are back and the stock is going to go bullish from here.
It still is a good time to enter the market!
Conclusion
In conclusion, the dragonfly doji may be formed in a bullish or bearish market space. The bullish perspective is more significant, and the dragonfly doji formation after a downtrend generally signals its end. The formation of the dragonfly doji happens at the opening of prices when the selling activity is predominant.
As prices plummet at a low-enough level to unravel renewed buying, prices meet new highs until they reach the opening price. Traders can now start assuming short positions as the trading sentiment is about to change.
For traders, it is an important consideration as it may account for a complex pattern in the vicinity.
In case you are looking to get started with using such trading chart patterns or generic stock market investments, let us assist you in taking the next steps ahead:
More on Share Market Education
In case you are looking to learn more about Chart Patterns, here are some reference articles for you:
Summary
Reviewer
A Digital Blogger
Date
Broker Name
Dragonfly Doji
Overall Rating
