


Looking for Low Brokerage, High Margin & Free Tips?
Falling Wedge Pattern
| | Chart Patterns | No Comments
More Chart Patterns
Falling Wedge Pattern is one of the tools used by traders who use technical analysis of stocks to take positions in equity and currency markets. A falling wedge pattern signals a bullish reversal in prices of the securities. It is also termed as the descending wedge pattern by traders.
This article will talk about how to identify trading opportunities using this pattern and make use of them in order to increase one’s wealth.
Falling Wedge Pattern Definition
In order to understand the falling wedge pattern, let us first try to understand what a wedge means.
Well, in the simplest terms, A wedge is nothing but a pattern of prices that are marked by multiple converging trend lines on a stock price chart. All the highs and lows over a 10 to 50 trading periods are joined by two lines in a price series.
These two lines or trend lines show a rise or fall and look like a wedge. These wedge lines indicate bullish or bearish trend reversals. In this article, let us discuss the falling wedge pattern in particular.
A falling wedge pattern is formed by the two converging trend lines when the price of a security has been falling over a certain time period. Before the lines converge, buyers start coming in the market and as a result of this, the decline in prices starts to lose momentum.
This can result in the security price breaking above the upper trend line.
Also Read: Rising Wedge Pattern
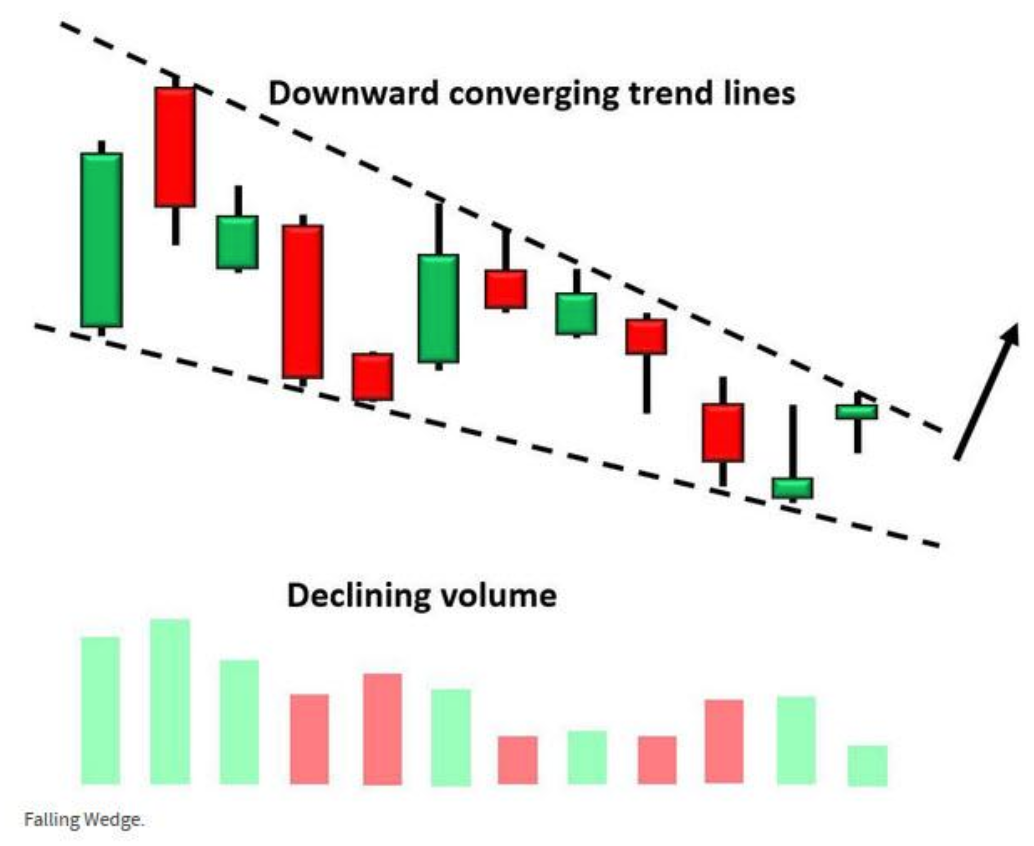
A falling wedge pattern can be recognized by 3 things:
- The presence of two converging trend lines.
- With the progression of prices, volumes traded show a decline in numbers.
- A breakout of price from the upper trend line.
The picture posted below shows all the aspects of a falling wedge pattern:
Falling Wedge Technical Analysis
Depending on the location of the falling wedge pattern on a chart, it can signify two things which have been discussed below:
Falling Wedge Pattern in Downtrend:
It implies a reversal of the Pattern and Beginning of the New Trend.
When a falling wedge pattern is spotted in a downtrend on a chart, it signifies a reversal in the existing uptrend. It is formed when the price of the security makes lower highs and lower lows in comparison to the previous price movements in the given time period.
This pattern is usually followed by a reversal in the downtrend to the upside. Hence, this forms an opportunity to take long positions in the market.
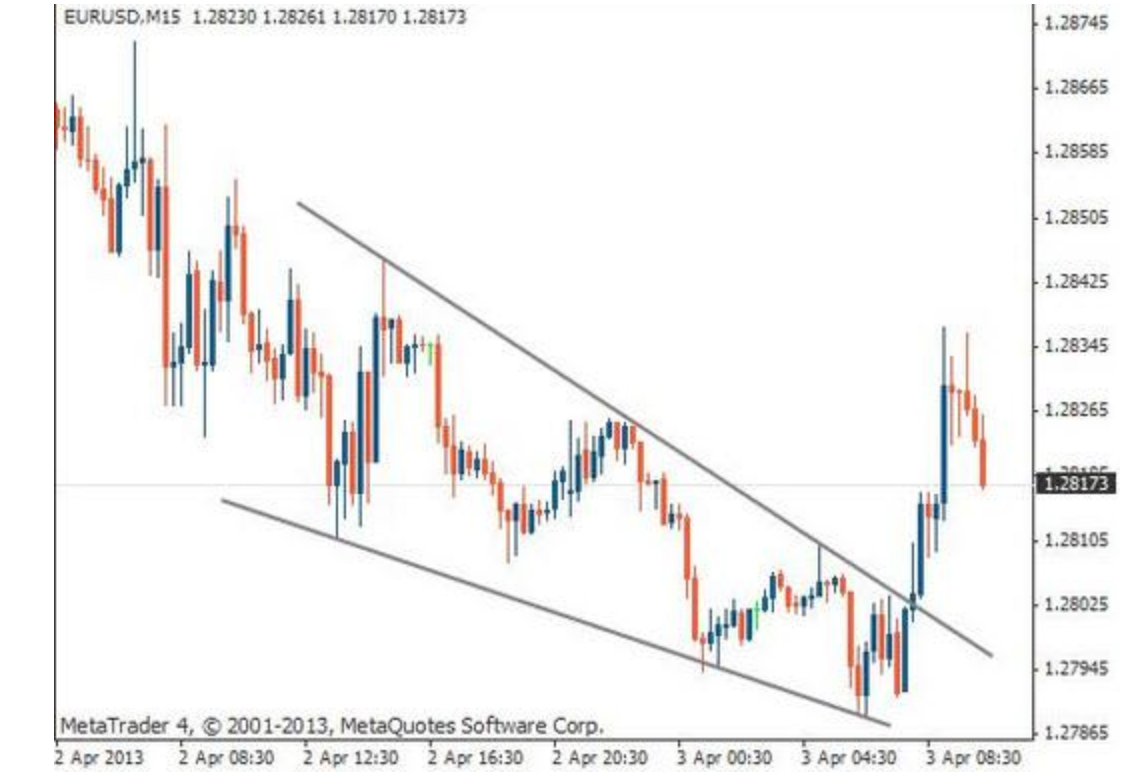
This can be seen in the below picture taken from currency markets:
Figure 1
In this technical chart, it is clearly visible how a falling wedge pattern is being formed by the price movement of the currency pair. This pattern has been followed by an uptrend.
Taking a long position after spotting this pattern would have given very good returns just in a very small period of time.
Falling Wedge Pattern in Uptrend:
It implies a continuation of the Existing Trend.
When a falling wedge pattern is spotted in an uptrend on a chart, it signifies a continuation of the existing downtrend. It is also formed when the price of the security makes lower highs and lower lows in comparison to the previous price movements in the given time period.
This shows the contraction of the markets temporarily. Hence, this also forms an opportunity to take long positions in the market.
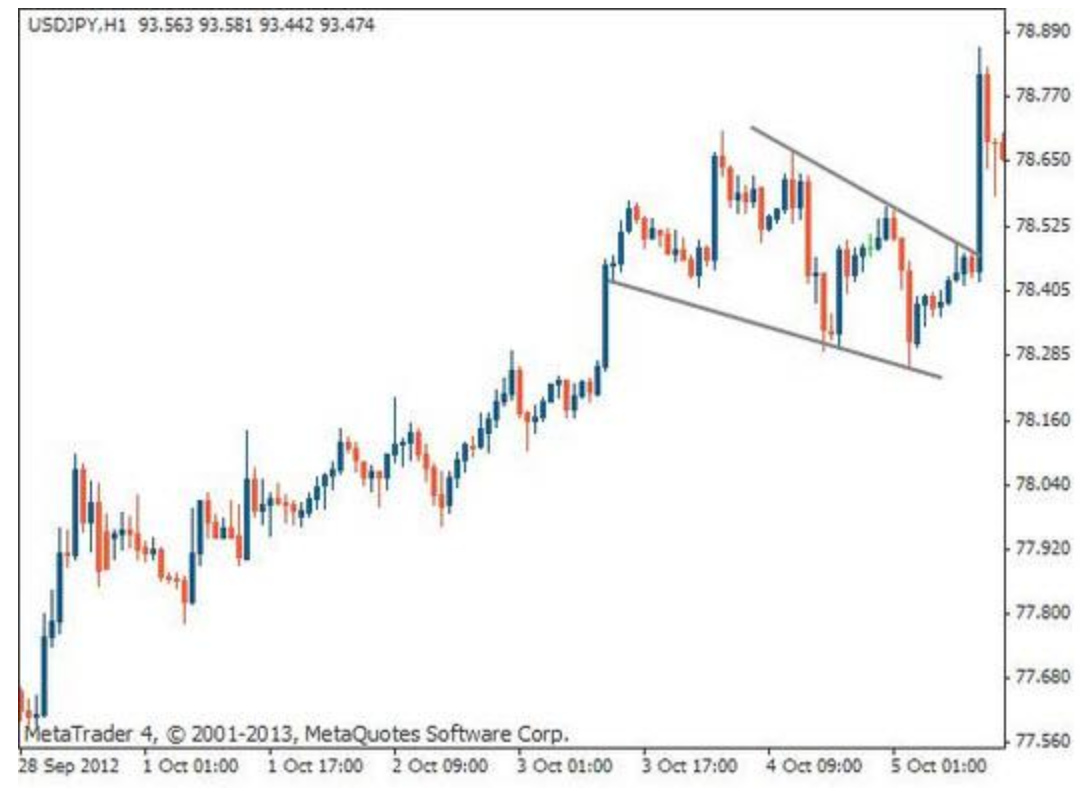
This can be seen in the below picture taken from currency markets:
Figure 2
In this technical chart, it is clearly visible how a falling wedge pattern is being formed by the price movement of the currency pair. This pattern has been followed by an increase in prices.
This means the continuation of the existing trend. Taking a long position after spotting this pattern would also have given very good returns just in a very small period of time.
Falling Wedge Pattern Strategy
There are two strategies of trading using the falling wedge pattern. Let us discuss both of them one by one.
Falling Wedge Pattern Strategy 1:
The first strategy suggests taking a long position when the price breaks the top side of the wedge. Before taking a trade, one should make sure that it is not a false breakout.
One should wait for the closing of the security price to occur above the top trend line. In figure 1, according to strategy 1, a trader should have taken a long position when the breakout had happened.
Stop-loss should be fixed at the bottom price of the lower trend line. Target should be set in the following manner. The height of the back of the wedge should be measured. That much distance should be extended on the chart after the breakout of the top trend line.
Falling Wedge Pattern Strategy 2:
The top trend line can be called as a resistance in the chart. According to strategy 2, one should wait for the price to trade above the resistance. A trade should be initiated after the retest of the top trend line. Now, the broker resistance can be referred to as the support on the chart.
Stop-loss should be fixed below the new support area. And to calculate the target profit, one needs to measure the height of the back of the wedge and extend it on the chart from the entry point of the trade.
Falling Wedge Pattern Success Rate
The success rate of any strategy in stock and currency markets cannot be 100%. There is always a possibility of prices moving in the unfavourable direction.
Therefore, it is imperative to stick to the predefined stop loss in any trade. Generally, in case of a falling wedge pattern, the breakout is in an upward direction. It has been calculated that the upward breakout has been 68% of the times.
In order to use Falling Wedge Pattern for trading purposes, one should also pay attention to other factors like volume of trades, Relative Strength Index (RSI), etc.
If the pattern is supported by other technical indicators also, it becomes much stronger and the probability of it giving successful trades increases many times.
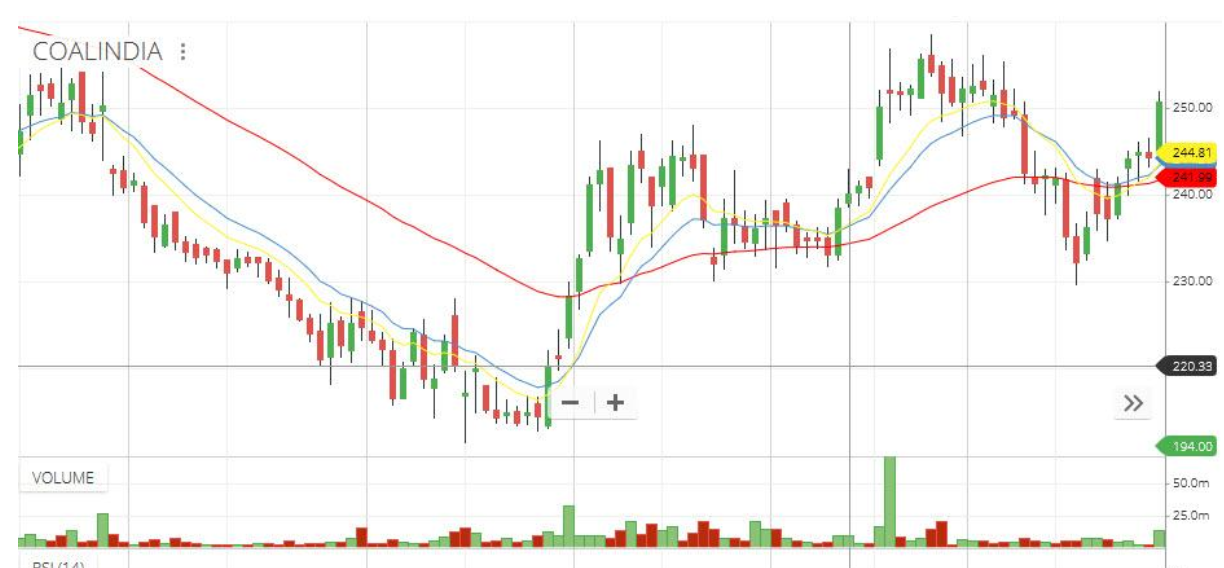
Falling Wedge Pattern Example
Let us now examine a real-life example of a falling wedge pattern after which a breakout was witnessed. In the daily charts of Coal India Limited pasted below, this pattern can be seen after a downtrend.
It signifies the reversal of the trend.
A long bullish candle along with high traded volumes has broken out from the top trend line of the pattern on February 26, 2019. As one can see, February 26, 2019, has been the beginning of the uptrend for the next few days.
Had one initiated a long position at this time, one would have earned a huge profit during the following period of the uptrend.
Falling Wedge Pattern Screener
There are many online screeners present which can screen stocks on the basis of any defined criteria. Some of them are paid and some are free. Some broking platforms also provide this facility of screening stocks.
In order to initiate a trade after witnessing this pattern, one can use such screeners in order to catch them as soon as the breakout of price has happened after the formation of this pattern on the daily or weekly technical charts of stocks and currencies.
Conclusion
A falling wedge pattern is made from two converging trend lines when the price movements start to show lower highs and lower lows in a technical chart.
This can signify two things – the continuation of the existing trend and reversal of the trend. Buying opportunities arise in both situations.
There are three things that are required to be witnessed in order to identify a falling wedge pattern.
The first one is the presence of two converging trend lines.
The second one is a decline in volumes traded along the way of the formation of the wedge. The last one is a breakout happening above the top trend line.
One can apply two strategies in order to initiate a trade after this pattern has been witnessed on a technical chart.
The first one is to take a long position as soon as the price breakout from the top trend line has happened and the closing price has reached above the top trend line price.
The other strategy can be applied by taking a long position after retesting of the previously broken resistance happens. A pre-defined stop loss needs to maintained in both the strategies to shield oneself from unfavourable price movements in the markets, the probability of which is never 0.
The stop loss is set below the bottom of the wedge. On the other hand, the target profit is calculated by extending the height of the wedge from the entry point of the trade on the chart.
In today’s technological era, one should make use of stock screeners in order to identify buying opportunities.
If you are looking to get started with stock market trading or investing using such chart patterns, let us assist you in taking the next steps ahead.
Just fill in a few basic details to get started:
More on Chart Patterns
Here are some other chart patterns for your reference:
Summary
Reviewer
A Digital Blogger
Date
Broker Name
Falling Wedge Pattern
Overall Rating
