


Looking for Low Brokerage, High Margin & Free Tips?
Inverted Hammer
| | Chart Patterns | No Comments
More Chart Patterns
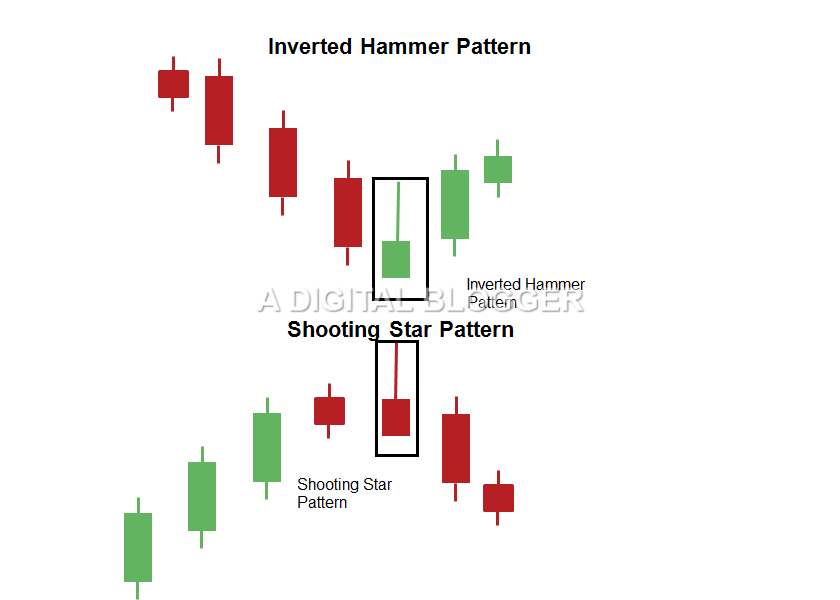
The inverted hammer is a candlestick pattern that gets its name from its resemblance to an inverted hammer in real-life, literally. It is a reversal pattern, clearly identifiable by a long shadow at the top and the absence of a wick and the bottom. The long shadow at the top is generally twice the height of the real body of the candle.
Here is a quick look at its formation (pretty straight forward to identify):
The inverted pattern comprises only a single candlestick. You are most likely to witness an inverted hammer candlestick towards the end of a downtrend. The body of the inverted hammer is either light or dark.
Inverted Hammer Pattern
When we talk about an inverted pattern, any inverted pattern for that matter, it implies that the price is going to change. This is not about going into a specific trend but sending out a warning that the market/sector/stock/product is going to shift its momentum.
In the case of Inverted hammer pattern, the market is all going up with buyers taking control and pushing the price high. However, momentum shifts and the sellers take the price back to the opening price.
This pattern sends out multiple buys and sells signals in different instances. And as a sharp trader who trades based on technical analysis of stocks, it should ideally be coming naturally to you which signal to accept at what time.
Inverted Hammer Meaning
Oh, wait!
Not sure of the meaning of inverted hammer yet!
Okay, let’s take a step back and understand its definition.
If you know what a hammer pattern means, then this is the exact opposite of it. (if you don’t, then here is a quick review of hammer candlestick).
This is a single candle-based pattern in which the long shadow of the pattern projects from the top of the trend.
You can say that it is one of the trend-reversal patterns.
Inverted Hammer Formation
The inverted hammer pattern is formed in a bull-dominated market when bulls successfully prevent the bears from pushing prices down. Stock activity shows an explicit downtrend at a critical support level. Once trading begins, buyers cause the prices to rise and create demand.
As time passes, selling activity is on the rise due to low prices. In response, the stock supply increases. Henceforth, the bulls reach a crucial level and start accumulating this stock.
No matter how much selling activity occurs, a neutral state occurs as buying power exerts an equal and opposite increase towards the lower level.
Eventually, the demand is more than the supply and prices are under control. The close is near the opening, at a point not far above or below its opening price. This is how the small body forms, with a clearly discernible upper shadow, and a negligible lower shadow.
Inverted Hammer in Uptrend
The inverted hammer is a signal for a bearish reversal as it appears shortly after a drop in stock and indicates the sign of strength. The signal appears in a scenario when stock tries to move up but the prevailing downtrend prevents it.
As the stock tries to move high, the bearish dominance of the market pushes it down and forms the top tail of the inverted hammer.
Although it may initially look like the trend is continuing, one cannot deny that it appears near a support area and signifies bullishness of the stock. The bulls are in a tug of war with the bears, trying to push the stock high up to new levels.
As indicated earlier, the body of the inverted hammer candlestick could be either dark or light. However, the lighter body is generally accompanied by a stock that closes higher and is more powerful than its counterpart.
Inverted Hammer After Uptrend
Once the uptrend is out of the picture and the sellers are running the show, then the pattern is in for a trend reversal.
The stock price is going to take a plight back to the opening price of the day and then it is most likely going to stay around that price till the end of the trading session.
You may wait for the next trading session to open and observe whether the stock is going to go down further the hill or the buyers are going to give it another shot and take the stock to better positioning.
Inverted Hammer Trading Strategy
If you are looking to trade using the Inverted Hammer candlestick pattern there are a few aspects that MUST take care of. In case you are successful doing so, the overall trading and money making process become much simpler and in control.
Important Signs to Confirm the Pattern
The inverted hammer candlestick signal is one of the major reversal signals in stock trading. Investors must consider confirmation criteria before trading with the inverted hammer signal.
Verifying that the upper side is double the length of the body towards the lower end of the trading range, and the lower shadow is negligible or very small, are some of the aspects to look for before starting to trade with the signal. Certain other factors also contribute to better speculation in the trading space.
The length of the upper shadow is directly proportional to the chance of a reversal. Another significant hint is a gap down with respect to the close of the previous day, which prepares the ground for a strong reversal.
The ideal day to start trading is the day after the occurrence of the inverted hammer signal, during which time it opens higher.
The final aspect of the inverted hammer signal is the level of volume on the day when the inverted hammer signal occurs. High volume on this day increases the chance of a blow-off.
The Rationale behind the Inverted Hammer Signal.
The market climate is bearish in response to a downtrend.
The price may start to trade higher and the bulls do not generally pick up the required strength. Prices go down to the lower trading range by the action of the sellers. The bears generally dominate the market for the entire day.
However, the bulls try to regain strength the next day, and the price increases as the bears are unable to exercise the required resistance. When this price maintains its strength even on the following day, it indicates the signal confirmation for the inverted hammer.
Important Trading Insights
The inverted hammer candlestick pattern is very closely related to other Japanese candlestick patterns which are the shooting star pattern, the hanging man pattern, and the hammer candlestick.
As specified earlier, the inverted hammer, similar to the hammer, is often spotted in downtrends indicating a bullish reversal. In rare cases, traders may rely on them as bearish flags.
The inverted hammer is slightly different from the regular hammer candlestick pattern.
In the case of the inverted hammer, the candlestick base is close to the nearest slow in the downtrend, and the shadow is characteristic of a bullish retracement.
Traders often view its appearance and position very closely to find the next move. The inverted hammer candlestick pattern must not be confused with a shooting star pattern. There is a slight difference between the two in that the inverted hammer appears at the low and not the high of the trend line.
It is also important to note that inverted hammers do not occur as often as the regular hammers. As a result, the signals produced by inverted hammers are far more confusing.
To make sure that traders are not at a disadvantage because of weak signals, the length of the shadow of the inverted hammer signal is most important.
Although a shadow that is twice the length of the body is confirmation in most cases, its body may sometimes be very small and its shadow is small as well.
It may sometimes be confused with the borderline doji pattern. Therefore, to understand whether the inverted hammer candlestick is worthwhile for trading, most investors consider the candle range to find out if it is twice the overall average range for a specific time.
This accounts for incorporating significant bullish retracement and the resultant signal is most probably a promising entry signal.
Conclusion
Although certain analysts may not recommend that the signal is used in the form of a trigger for entry, investors who choose to still use it are at an advantage if they wait for a bullish confirmation candlestick.
The inverted hammer trading signal performs better in the form of a bullish signal with respect to time frames which span four hours or a single day.
When considering higher time frames, it is used in the form of an entry signal to start selling and not buying.
It is important to note that a bullish confirmation candle generally reduces the chance of a possible profit. Overall, context is very important for the inverted hammer formation.
Firstly, it must occur after a downtrend. Moreover, effective trading is not possible in the case of consolidating price action when flat or sideways markets are prevalent. Nevertheless, it is a powerful trading pattern when used with the justifiable confirmation.
In case you are looking to get started with using such trading chart patterns or generic stock market investments, let us assist you in taking the next steps ahead:
More on Share Market Education
In case you are looking to learn more about Chart Patterns, here are some reference articles for you:
Summary
Reviewer
A Digital Blogger
Date
Broker Name
Inverted Hammer
Overall Rating
