


Looking for Low Brokerage, High Margin & Free Tips?
Three White Soldiers
| | Chart Patterns | No Comments
More Chart Patterns
Three White Soldiers Candlestick is a pattern used in technical analysis of stocks, currencies, indices, etc. to predict the reversal of the downtrend. This pattern is also known as Three Advancing White Soldiers. It happens after a long downtrend when bullish forces start becoming greater than the bearish forces on three consecutive days.
After this bullish pattern is identified in technical charts, an opportunity to take a long position arises in order to gain an advantage of reversal of the downtrend.
Three White Soldiers Technical Analysis
Three White Soldiers Candlestick Pattern is a visual pattern and is quite easy to detect in a chart. No calculations need to be done by traders or investors to spot it.
Thus, even if you are a beginner trade, even then it won’t be much of a problem for you to identify it amidst a lot of chaos in the market trend.
There are three consecutive green candles with long bodies on three trading days.
A candlestick chart shows open, low, close and high prices of a trading day.
The candles in three white soldiers should have long bodies with short or nonexistent upper and lower shadows. This means that the price of the security has remained within the low and high range of the day.
Traders use this pattern as an entry or exit point. The traders who have been playing short in a security exit from the trade as soon as they spot a three white soldiers pattern in the charts.
And the traders who have been looking for an opportunity to buy securities or play long, use this pattern as an entry point.
Three White Soldiers In Uptrend
In this pattern, each candle needs to open a little above the open price of the previous day. After the opening, the price of the stock should be pushed higher throughout the trading session.
The closing of each candle should be above the close of the previous day’s trading session. This momentum in the upward direction indicates the beginning of the bullish trend.
Generally, the Three White Soldiers Candlestick Pattern form a support zone.
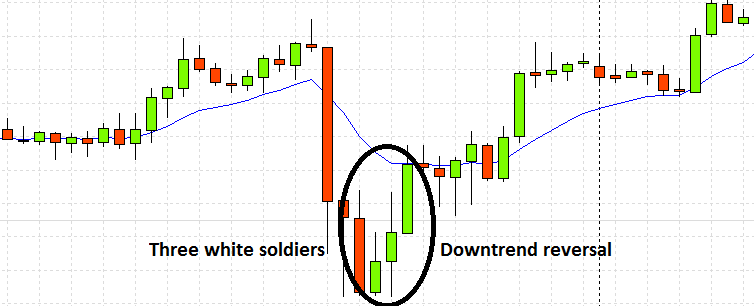
One should also pay attention to the location of the pattern in the chart. It looks like the picture posted below:
Three White Soldiers Conditions
Here are the specific conditions that need to be met in order to identify a pattern as a Three White Soldiers Pattern:
Condition 1:
The first candle is seen in an ongoing downtrend. It should be green in colour which means that the close price is higher than the open price of the security. It can be a small or long bullish candle.
Condition 2:
The second candle should also be green in colour and can either be a long or small candlestick.
It’s opening price should lie within the body of the previous red candle. The opening price of the second-day candle should preferably be between the middle point and high price of the previous day’s candle.
The closing price must be above the close price of the previous day’s candle. Also, the second-day candle should break the high price of the first day’s candle.
Condition 3:
The third candle should again be green in colour and can either be a long or small candlestick. It’s opening price should lie within the body of the previous red candle.
The opening price of the second-day candle should preferably be between the middle point and high price of the previous day’s candle.
The closing price must be above the close price of the previous day’s candle. Similar to the second day’s candle conditions, the third candle should break the high of the second day’s candle.
Note: In a Three White Soldiers Candlestick Pattern, the first candle or the second candle or the third candle or any two of them or all of them can be bullish marubozu candles.
A bullish Marubozu candle means that the opening price of the stock is the low price of the day and the closing price is the high price of the day.
There are no upper and lower shadows in the candlestick.
There can be 8 possible combinations of candles in this pattern.
This pattern works very well if the upper shadows of the candlesticks are very small or absent altogether (which means equal closing price and the high price of a trading session)
Trading With Three White Soldiers
In order to use Three White Soldiers Candlestick Pattern for trading purposes, one should also pay attention to other factors like volume of trades, Relative Strength Index (RSI), etc.
If the pattern is supported by traded volumes, it becomes much stronger.
The volume traded on the third day should be more than the volume traded on the first day of the pattern.
Although the volume traded on the second day does not matter much, but if it is more than the volume traded on the first day, it is an added advantage for us.
In simple words, the volumes of the candles in three white soldiers pattern should be in increasing order.
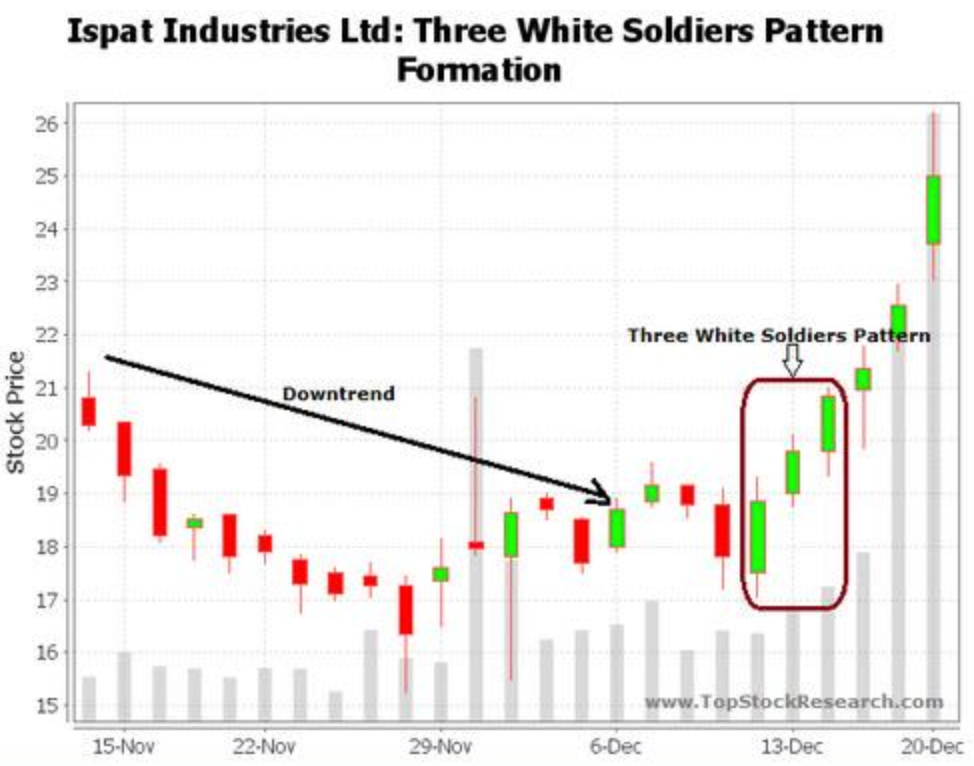
Three White Soldiers Example
Let us look at a real-life example of three white soldiers candlestick pattern. It is clearly evident in the technical chart of the stock of Ispat Industries Limited.
A long downtrend can be seen on the chart and three consecutive green candles can be seen almost at the bottom of the chart. These three candles fulfil the necessary conditions of the three white soldiers candle pattern.
And quite evidently, this is followed by the upward movement of the stock price in the next few days.
Three White Soldiers Strategy
This pattern in technical analysis can be used by traders and investors to initiate and exit existing trades. It is a very strong bullish pattern which signals the end of the downward trend. It works very well on monthly, weekly, daily and intraday charts.
It can be spotted on the daily and intraday charts.
When three white soldiers have been identified on a technical chart and the next candle shows a gap up opening, i.e. the opening price is higher than the closing price of the previous day, one should initiate a long position in the stock or index.
This is a kind of confirmation of trend reversal. After this pattern, the bullish forces start overpowering the bearish forces.
In intraday trading, one can look at 5 minutes, 15 minutes and hourly charts to identify this pattern. If a trader is into positional trading, then, he / she must look into the daily and weekly technical charts to trade according to this pattern.
Although, it is quite rare to spot this pattern on charts.
The confirmation of trend reversal is the breaking of the last close. After initiating a long trade, one should define a stop loss of the last low. The profit can be taken as soon as there is any other sign of trend reversal on the charts.
These are the entry and exit points of the trade according to three white soldiers candlestick pattern.
Also read: Candlestick Chart Types
Three White Soldiers Screener
There are many online screeners present which can screen stocks on the basis of any defined criteria.
Some of them are paid and some are free. Some broking platforms also provide this facility of screening stocks.
In order to initiate a trade after witnessing this pattern, one can use such screeners in order to catch them as soon as the pattern has occurred on the charts.
Conclusion
Three White Soldiers Candlestick Pattern is a trend reversal pattern which is formed during a downtrend and signals an uptrend in stock prices very strongly. Although this pattern is quite rare to find, if found, can act as a very strong signal for a trend reversal.
This pattern is formed by three normal bullish or bullish marubozu candlesticks when the open of the second candle is between the middle point and high price of the previous one and the close is above the higher than the first one.
Similarly, the open price of the third candle is between the middle point and high price of the second one and the close is above the high price of the previous one.
After the price crosses the last high, a trade should be initiated as this is a complete confirmation of the downtrend.
This pattern should be seen along with other factors like volume traded and other technical indicators like RSI to give better and more accurate results. Volumes traded on three consecutive days of three white soldiers candlestick pattern should be in increasing order.
Once a trade is initiated after the detection of three white soldiers candlestick pattern, profit should be taken only after some signs of trend reversal are identified on the technical charts.
Traders can use three white soldiers pattern either for initiating a long trade or exiting an existing short trade and gain a profit. The entry and exit points of the trades should be fixed and worked on with complete discipline.
One should take advantage of online automatic screeners in order to know when to initiate a trade and when to take a stop loss.
In case you are looking to get started with stock market trading or investments, let us assist you in taking the next steps ahead.
Just fill in basic details below:
More on Share Market Education
If you wish to learn more about the chart patterns and other related topics from the share market, here are a few references for you:
Summary
Reviewer
A Digital Blogger
Date
Broker Name
Three White Soldiers
Overall Rating
