


Looking for Low Brokerage, High Margin & Free Tips?
Hammer Candlestick
| | Chart Patterns | No Comments
More Chart Patterns
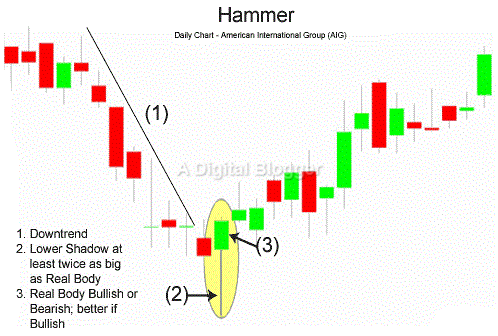
Hammer Candlestick is a bullish reversal pattern that is visible towards the end of the downtrends. When the same price is associated with an open, high, and close, a hammer formation occurs.
It may look a little strange for all these price points to see such a consolidation, but this happens.
In this detailed review, let’s understand how the formation of a hammer Candlestick takes place, how you can identify it and then use it to your advantage in real-time trading as part of your technical analysis.
Hammer Candlestick Meaning
A similar value for high and close gives rise to a stronger formation and as the bulls overcome the bears, they push the prices way past the initial value. On the other hand, when high and open have similar values, the bulls may appear to counter the bears, but may not be able to pull back all the way where it started initially.
A long lower shadow is characteristic of the hammer Candlestick pattern and this implies that the market has been sufficiently tested to locate support and demand.
An area of support may encourage the bulls to push prices towards the high end, close to the initial price, and even though the bears advance towards the low end of the price, their move is rejected by the bulls.
Hammer Candlestick Formation
Hammer candlestick patterns are important tools for traders as they help them identify price continuity and price reversal. Stock traders look at the bullish hammer candle to identify a point where a downtrend turns the other way round.
A hammer Candlestick pattern generally appears when a new low is created for a specific currency pair. The wicks of hammer candlesticks measure twice as much as their bodies.
As a stock trader, it is important to understand that although the bullish hammer candlestick may appear similar to a bearish hanging man pattern, the two are quite different. The difference between these two candles can be easily understood by studying their exact placement on a trend line.
You will find the hanging man pattern at the end of an upward trend, and the bullish hammer at the end of a downward trend.
Hammer Candlestick Pattern
A hammer Candlestick helps traders discern the location of support and demand.
Subsequent to the occurrence of a downtrend, the hammer Candlestick signals trading experts about the resolution of a downtrend and the uncovering of potential short positions. The hammer Candlestick serves as a key tool to determine buy positions.
Successful traders use several strategies to make the most of the hammer candlestick pattern.
Sometimes, a trader may choose to wait for another day to spot continuity in a hammer Candlestick pattern. In other cases, an investor may look for any possible breaks in a trend line that moves downward. Sometimes, a Doji pattern may be combined with the hammer Candlestick to analyze stock trends.
Aggressive buyers often look for a hammer Candlestick during an uptrend when prices start to rise once again.
The occurrence of this pattern at such a point is a clear indication to start buying stock. Hammer candlestick patterns are often useful when they occur close to some support level. A buyer may not necessarily consider a hammer candlestick pattern as important when it occurs in the middle of a trend line without any support features.
Hammer Candlestick patterns may not necessarily be useful for traders in all scenarios.
Trading excessively with hammer Candlesticks may translate to losses. When the lower shadow is long and the upper shadow is shorter, and a small body of the hammer is observed, a stock trader may consider the situation favorable.
There are a number of trend line features associated with hammers that a stock trader may want to consider.
Firstly, a hammer must be preceded by a selling wave as opposed to a buying wave.
Secondly, as mentioned in the previous section, support to the left must accompany the hammer. If there is no support, then a trader may wait until the next day to confirm if a reversal is actually taking place.
Stock traders may also want to consider the range for a specific day and identify if it is greater than the range for the prior candles. Furthermore, when an increase in the volume is observed in the prior day, it is apparent that stocks are picking up at the current price.
You can successfully trade with hammer candlestick patterns if you look for a few typical features in a trend line.
Hammer Candlestick in Uptrend
The hammer Candlestick in its nature and as explained earlier is a bullish reversal pattern where bulls outrightly rejection of any bear actions. The bears try to kick the price down but then bulls come to the rescue and bring an uptrend to the pattern.
With this movement, the stock ends close to the high or the opening price for the trading session.
Having said that, this uptrend needs to be monitored for a few days in order to validate the formation of the hammer candlestick. Once you have this validation, you can take a corresponding transaction action (buy/sell) depending on the market movement.
Hammer Candlestick in Downtrend
A downtrend is eminent in a hammer candlestick pattern, otherwise, this pattern would cease to exist at all. When the pattern has reached the lowest spot of the trend, this is where the bullish action kicks in and the bears give up.
This is a direct signal to the traders that now they can consolidate their short positions as the trend reversal is on the cards.
For traders with a relatively lesser risk appetite, they can wait for the next trading session to open and observe the opening price of the day is better than the closing price of the previous session. This price movement from the downtrend can certainly help to instill confidence in the potential future movement of the stock.
Hammer Candlestick Reversal
This candlestick pattern is all about how the trend reversal happens for a stock that was completely controlled by the bears and was going down the barrel until it reaches a price point where the bulls come and take up the control.
This reversal, if figured quickly, provides you with a reasonable opportunity of raking in profits from the stock that most of the traders had given up for price points it did not deserve.
However, if you place a trade just before the reversal initiates and hold it for a time period till the stock price reaches a new high or the opening price itself, then you are in for a sizable profit, depending on the volume of the trade picked.
Conclusion
The primary aspect is the existence of a bearish trend, which gives way to a bullish hammer candlestick. At this point, the presence of a strong shadow is necessary to move further, irrespective of the color of the candlestick. You may also apply the Fibonacci golden ratio to hammer Candlesticks.
Experts agree that a little pullback in the market after the appearance of the hammer candlestick is important to determine a successful trading attempt.
Also Read: Pullback Meaning
A hammer candlestick pattern is a great tool for traders as it helps them take advantage of market opportunities with an optimal risk-reward ratio. Traders can look for known features around the trend to establish sound evidence on which to base their trading decisions.
Overall, the pattern has the potential to lead an investor to a streamlined approach to trading with success.
In case you are thinking of getting started with stock market investments or trading, let us assist you in taking the next steps forward:
More on Share Market Education
In case you are looking to learn more about Chart Patterns, here are some reference articles for you:
Summary
Reviewer
A Digital Blogger
Date
Broker Name
Hammer Pattern
Overall Rating
