


Looking for Low Brokerage, High Margin & Free Tips?
Descending Triangle Pattern
| | Chart Patterns | No Comments
More Chart Patterns
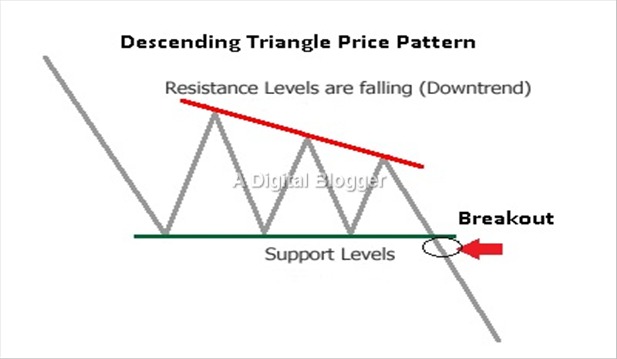
Descending triangle pattern is a bearish scenario with the series of consistent lower highs, forming a clear slanting line. This series is accompanied by a horizontal line that connects the top part of these lows.
In this detailed review, we will learn how to identify a descending triangle pattern, how it works and how you can employ it in your trades to maximize your profits.
Descending Triangle Pattern Identification
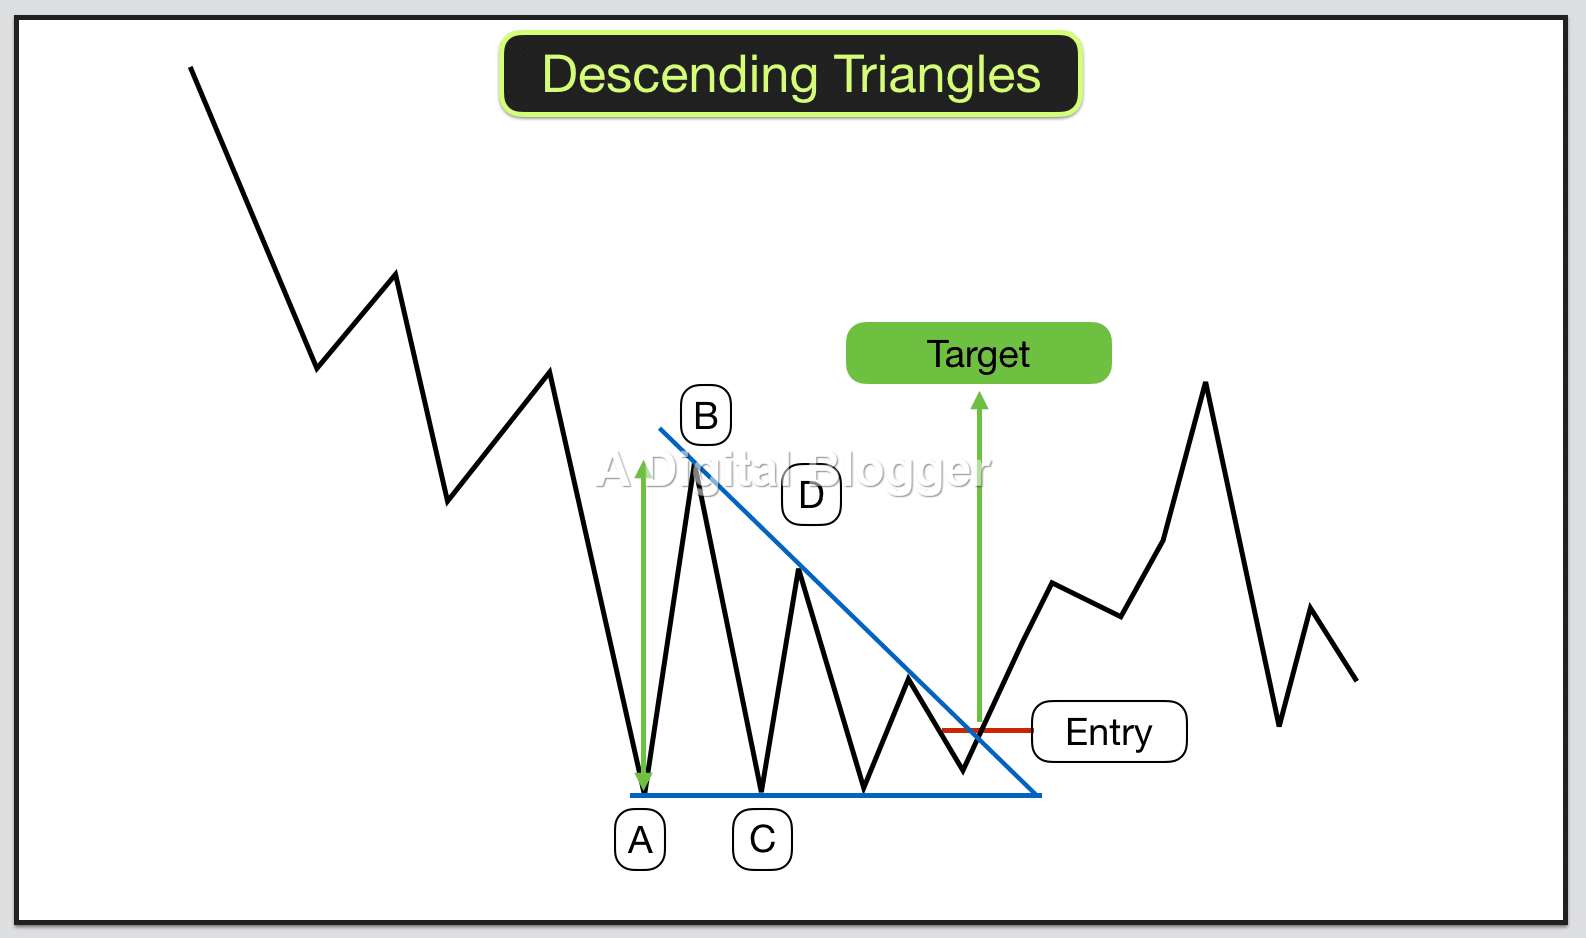
The descending triangle candlestick pattern has a horizontal line at the bottom with a downward sloping top. This pattern is characteristic of a bearish market scenario where prices go down to a certain support level. A series of lower highs form an upper line, and the lower line is the support level.
Towards the end of the pattern, the falling of prices continues even after it breaks the support line. Occasionally, a strong support line may form and cause the prices to bounce off. Whatever the case may be, an explicit descending triangle pattern is clearly visible.
The descending triangle pattern starts to form when either the price moves beyond a significant resistance force or an unfavourable market scenario encounters a support area and the price action is clear. In other cases, it acts as a target area with the potential for profit, or just an opportunity with an attractive price. At this point, the buyer force may increase, causing the price to limit as demand exceeds supply.
This change in the market force causes the price to rise up.
At this time, traders prefer to sell excess stock, supply increases, and the price goes down once again. When the price touches upon the previous support area, an increased demand causes the price to rise back again. However, this rise is not as much as the previous rise and the price moves down again.
Subsequently, it meets a high demand area once again, only to rise back. The lower highs are a result of the bearish dominance and the sequence that results is the hypotenuse of the upside of the descending triangle pattern.
How to Trade Descending Triangle Pattern
The descending triangle pattern is the central aspect of price action trading. The chart pattern most likely forms towards the end of a downtrend. It is exactly the opposite of what might be expected in an ascending triangle pattern. This pattern is ideal for trading breakouts.
As mentioned before, a descending triangle pattern is most likely bearish, but it may sometimes seem bullish as well. The bearish formation is a continuous pattern. When this pattern appears bullish, it is also known as the reversal pattern. You may use a number of strategies to trade with the descending triangle pattern.
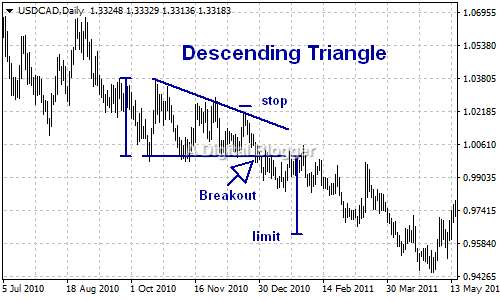
In a descending triangle pattern, the price bounces off at the support level at least two times. The breakout towards the downside of the chart from the support area indicates the momentum from a strong bearish trend which results in a decline.
A descending triangle pattern may also feature a break out to the downside, in which case a continuation pattern forms as opposed to the reversal pattern.
Traditional Trading Strategy
The simplest strategy to trade using the descending triangle pattern is the breakout strategy. This strategy is laid down in anticipation of the breakout. To capture short-term profits, a trader may pick a stock that is either in a consolidation phase or part of a downtrend.
The strategy is valid across any time. The task is to simply wait for price action consolidation once you have accurately identified the target stock and its associated time frame.
Flexibility is an important aspect of trading with descending triangle patterns. It helps to see how lower highs and lower lows are created. After this price action is clear, you may go ahead and draw the descending triangle pattern. A prudent trader also determines the volume after the descending triangle pattern forms and is confirmed.
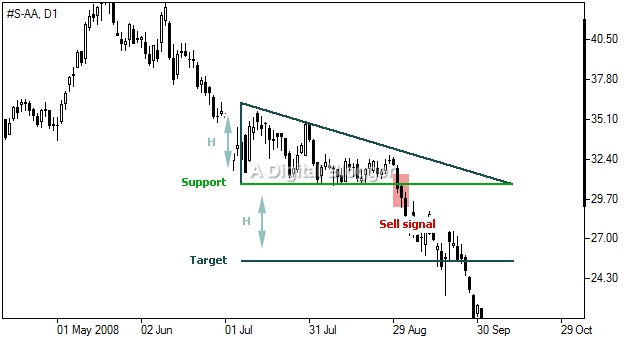
An important observation about volume is that it begins to diminish as the end of the descending triangle pattern approaches. A low volume is generally identified close to the breakout. After identifying the lower volume, it is a good strategy to measure the distance from the first high and low.
This is then projected from the breakout area and it becomes the target price.
Powerful Short-Term Strategy
The use of Heikin Ashi charts is a powerful short-term trading strategy for the descending triangle pattern. These charts help show the trend accurately. When using this strategy, traders generally wait until the descending triangle pattern is fully visible.
When they see the pattern, they look for bullish dominance in the market space. This particular characteristic of the market is clear just before a breakout and can be used as a signal to set up a long position just before the breakout.
The projections, in this case, are achieved by measuring the distance all the way from the first high until the first low and then projecting it from the anticipated breakout level. It is important to note the change in volume during this period.
Volume bars are important to show market sentiment and may alert traders of a bullish breakout that is underway.
The Use of Technical Indicators
Stock traders generally take advantage of technical indicators when applying tested price action techniques on chart patterns. One of the simplest indicators is the moving averages technique to accurately estimate the chance of a potential breakout.
The technique is useful in estimating when a breakout is going to occur to commence trading in a favourable market scenario.
The use of technical indicators such as moving averages does not need volume estimation or a bullish signal just before a breakout translates to a successful trade entry position. Traders usually combine an estimation of price target level with technical indicators in the descending triangle pattern to gain a stronghold in the market.
Descending Triangle Pattern Types
In this context, it is worthwhile to consider that the descending triangle reversal pattern at the top as well as the bottom can potentially occur. The descending triangle reversal pattern at the top is generally spotted in response to a decline in volume when stock prices do not make any new highs. This decline is also accompanied by the bulls losing control of the prevailing market dynamics.
Traders are also likely to spot a support level in the form of a horizontal plane depicting the action of the price. When price encounters the support level in a sequence of events, causing lower highs to occur, the resultant downside breakout is expected in the future.
To estimate the least distance for price movement just before a breakout, the initial high is the starting point. This distance is then projected lower down after price break below the support level.
The reverse is true for the descending triangle reversal pattern at the bottom. Price action diminishing at the end of the downtrend is clear in this case, and the price bottom is shown by the horizontal support level. Lower highs often occur in this pattern and price action is seen on the upside in this scenario. It is also possible to trade long positions using this strategy.
This type of pattern causes the price action to break out from the sloping trend line. Distance is measured from the horizontal support to the initial high, and this is projected from the breakout level. This projected distance, in turn, accounts for the target price level.
In conclusion, the descending triangle pattern is a popular candlestick chart pattern showing weakening demand. Stock traders prefer such triangles as they account for the right strategy to make much profit over a brief time period.
In case you are looking to get started with using such trading chart patterns or generic stock market investments, let us assist you in taking the next steps ahead:
More on Share Market Education
In case you are looking to learn more about Chart Patterns, here are some reference articles for you:
Summary
Reviewer
A Digital Blogger
Date
Broker Name
Descending Triangle Pattern
Overall Rating
