


Looking for Low Brokerage, High Margin & Free Tips?
Evening Star Pattern
| | Chart Patterns | No Comments
More Chart Patterns
Evening Star Pattern comes into the picture when the market uptrend has seen its peak and a bearish trend is going to follow it up. So, traders looking to exit at the right time from the market, should keep a close eye on the evening star pattern formation and must ideally be out of their trend as soon as this transition happens.
But is it that easy to identify?
What are some of the cues that you, as a trader, must keep an eye on so that it becomes relatively easier for you to identify an evening star pattern formation?
Let’s try to dig up answers to all these complexities in a pretty straight-forward manner, along with the help of a few examples.
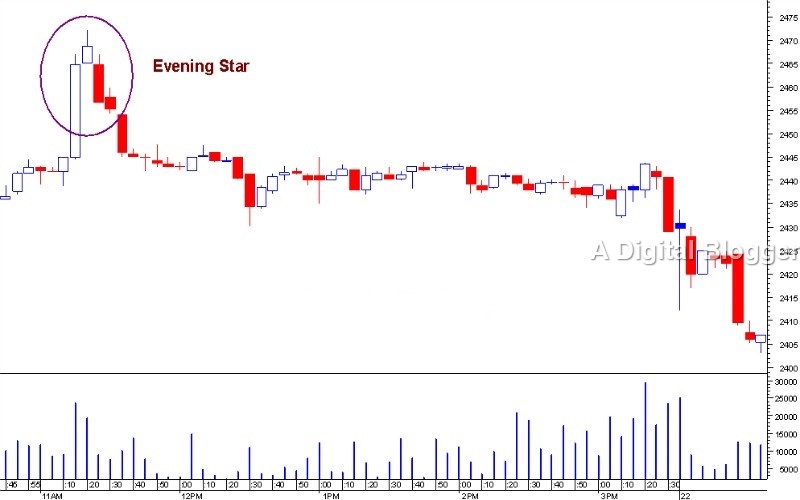
Evening Star Pattern Candlestick
Candlestick charts serve as important tools for technical analysts who are looking for evidence-based stock market predictions about the direction of prices.
They help traders identify whether bullish buying opportunities or bearish selling opportunities are available. Out of the multitude of bearish reversal patterns including dark cloud cover pattern, shooting star pattern, the bearish engulfing pattern and bearish Harami pattern, the evening star pattern formation is most popular among stock traders.
Trend changes can be easily understood by using other indicators with evening star arrangements.
Trend lines and price oscillators are two popular tools in use by investors which help confirm the viability of this candlestick pattern.
Evening Star Pattern Formation
Investors generally look for the evening star pattern at the top of an upward trend line. The evening star pattern is a bearish reversal pattern and contains three candlesticks.
In this pattern, a large bullish candle is spotted on the first day, followed by either a small bearish or bullish candlestick on the second day and subsequently, a large bearish candlestick.
- The first long bullish candle indicates a long move up.
- The second short candlestick represents a price consolidation and indecision in the market space. The second candlestick marks the loss of momentum which was evident in the first long bullish candlestick.
- Finally, the third bearish candlestick which forms lower than the previous candlestick confirms a reversal in market conditions and the beginning of a downtrend.
The bullish candle on the first day represents market control by the bulls and clearly indicates that new highs were achieved.
A bullish gap up forms at the beginning of the second day. Although the bulls are still in control of the market on the second day, the prices are unable to move significantly higher. The candlestick for the second day is very small and maybe either Doji pattern, bearish, or bullish. When a bearish candle is encountered on the second day, a reversal trend may be predicted by a typical investor.
Finally, entering into the third day is initiated by a gap down, which is a bearish signal. The bears are unable to push prices down and the gains experienced on the first day are neutralized.
The evening star pattern is a control shift from the bulls to the bears.
It is indicative of low stock prices as a bears’ victory is apparent after such a pattern is spotted. Technical analysts and investors can derive a lot of information about evening star candlesticks by studying a few key aspects of the pattern.
First, a greater force of reversal is associated with longer candles.
Secondly, a gap between the first and second day increases the odds of a reversal. When gaps exist in the area preceding and succeeding the star candle, there is a higher probability of a reversal. Another important insight into the nature of the reversal can be derived from the way in which the third candle comes down.
The lower the third-day candle in comparison with the first-day candle, the stronger the reversal.
Evening star patterns are governed by the nature of control of the bears versus the bulls. In its simplest form, the evening star pattern appears in the middle of a trend line with a formal uptrend to its left and a downtrend to its right.
In other cases, the bulls may try to regain control after a downtrend is initiated with an evening star pattern. This trend may not last long as the bears start to regain firmer control over market dynamics until they finally take over the market space in the form of a more consistent downward trend.
Sometimes, the evening star pattern is a brief shift from an upward trend to a downward trend in a predominantly downward trend line. The brief uptrend is usually visible only upon close scrutiny. However, it represents short-lived control of the bulls at this point in a bearish market space.
Evening Star Pattern Target
When you are looking to set an evening star pattern target, there are a couple of rules you may follow.
Keep an eye on the lowest point of the star formation and put a stop-loss at the peak of the formation. The lowest point of the star is your X and the stop-loss price is Y.
Risk (R) = X ~ Y
You can set the target as A + 1.5 to 2 times of R.
Furthermore, you can choose to sell when the price goes above the stop-loss price or Y.
Evening Star Pattern Reliability
When the third candlestick opens below the body of the star candle, the pattern is considered to be more reliable. In the situation, which is rarely witnessed, a gap is formed between the body of the star and the body of the third candlestick.
Another measure of reliability is the extent to which the body of the third candlestick maps to the body of the first one. When the third candlestick has little or no lower shadow, the pattern is considered to be more reliable.
When the first candlestick has a lower volume, and the third candlestick has a higher volume, the pattern is considered to be more reliable. Therefore, the beginning of an evening star pattern can be useful in identifying viable selling opportunities at the time of bearish momentum.
With this, we would like to wrap up this piece on the Evening star pattern. In case you are thinking of getting started with stock market investments, let us assist you in taking up the next steps forward:
More on Share Market Education
In case you are looking to learn more about Chart Patterns, here are some reference articles for you:
Summary
Reviewer
A Digital Blogger
Date
Broker Name
Evening Star Pattern
Overall Rating
