


Looking for Low Brokerage, High Margin & Free Tips?
Rising Wedge Pattern
| | Chart Patterns | No Comments
More Chart Patterns
Rising Wedge Pattern is one of the tools used by traders who use technical analysis of stocks to initiate positions in stock and currency markets. A rising wedge pattern signals a bearish reversal in prices of the securities. The other name of this pattern is the ascending wedge pattern.
Generally, this pattern is observed when the price of a security has been increasing over a period of time but sometimes, one can observe this pattern even in times when the prices of the security are showing a downtrend.
In this article, we will talk about how we can identify trading opportunities using a rising wedge pattern and make use of them in order to make profitable trades.
Rising Wedge Definition
In order to understand the rising wedge pattern, let us first try to understand the meaning of a wedge. A wedge is a shape formed by two converging trend lines on a technical price chart.
All the highs and lows over a 10 to 50 trading periods are joined by two lines in a price series.
These two lines or trend lines show a rise or fall in stock prices and give the appearance of a wedge. These wedge lines can indicate two types of trend reversals – bullish and bearish.
In this article, let us discuss the rising wedge pattern in particular.
Also Read: Falling Wedge Pattern
A rising wedge pattern is formed by the two converging trend lines when the price of a security has been rising over a certain time period. Before the lines converge, sellers start coming in the market and as a result of this, the increase in prices starts to lose momentum.
This can result in the security price breaking down the lower trend line. Although a wedge can result in price breakout from either of the trend lines but usually, the price break out is in the opposite direction from the trend line.
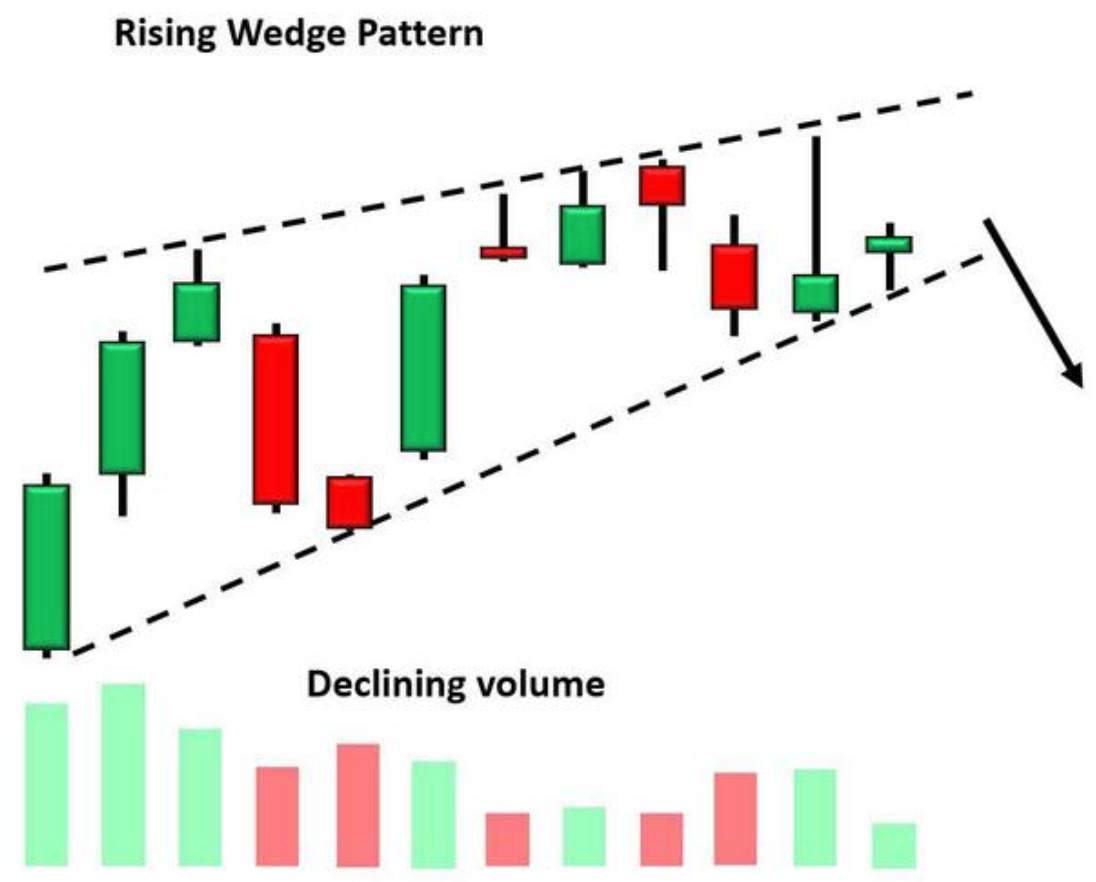
A rising wedge pattern can be recognized by 3 things:
- The presence of two converging trend lines.
- With the decline in prices, volumes traded show a decline in numbers.
- A breakdown of price from the lower trend line.
The picture posted below shows all the aspects of a rising wedge pattern:
Rising Wedge Technical Analysis
Depending on the location of the rising wedge pattern on a chart, it can signify two things. Both the scenarios have been discussed at length below:
Rising Wedge in Downtrend:
Continuation of the existing trend: When a rising wedge pattern is spotted in a downtrend on a chart, it signifies the continuation of the previous trend.
It is formed when the price of the security makes higher highs and higher lows in comparison to the previous price movements in the given time period. This can be seen in shrinking prices within the two trend lines. This pattern is usually followed by a breakdown of the security price in the downside.
Hence, this forms an opportunity to take short positions in the market.
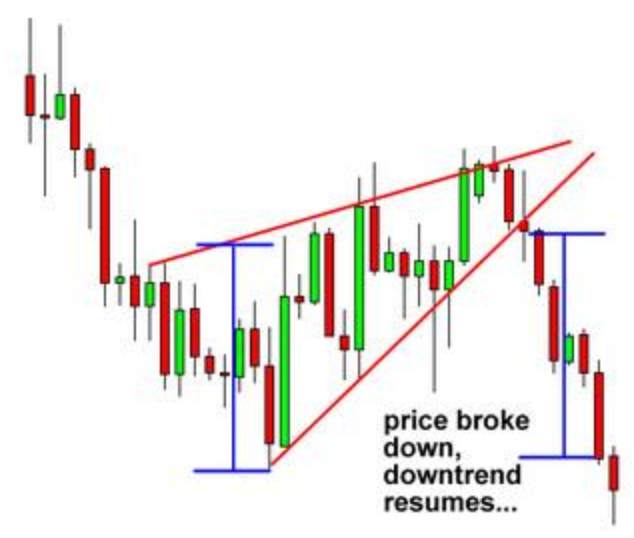
This can be seen in the picture posted below:
A clear downtrend in prices of the security can be seen before the formation of the wedge in the chart. After the steep decline in prices, there has been a consolidation phase and the formation of the wedge on the charts.
After the wedge has been formed, a sharp decline in prices can be seen again on the charts which are seen in continuation of the downtrend happening before the formation of the rising wedge.
Rising Wedge Uptrend:
Reversal of the Pattern and Beginning of the New Trend: When a rising wedge pattern is spotted in an uptrend on a chart, it signifies a reversal of the existing downtrend and beginning of an uptrend.
It is also formed when the price of the security makes higher highs and higher lows in comparison to the previous price movements in the given time period. One can see a contracting range in prices.
Hence, this also gives an opportunity to take short positions in the market.
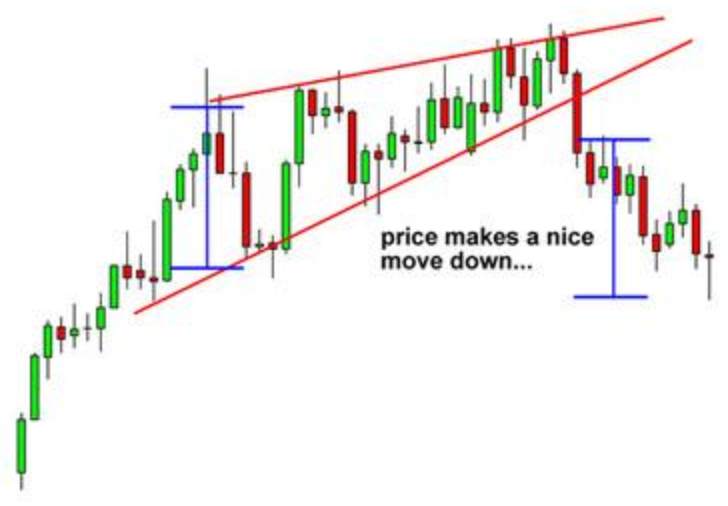
This can be seen in the picture posted below:
A clear uptrend in prices of the security can be seen before the formation of the wedge in the chart.
After the sharp rise in prices and formation of many bullish candles on the chart, there has been a consolidation phase and the formation of the rising wedge on the charts.
After the rising wedge has been formed, a sharp decline in prices can be seen on the charts. This is an example where rising wedge pattern has shown a reversal in the trend and the beginning of downtrend in security prices.
If one can identify such opportunities in the markets with good accuracy, one can earn very lucrative returns in a very short amount of time. This is the beauty of the wedge patterns.
Rising Wedge Strategy
There are two strategies of trading using the rising wedge pattern. Let us discuss both of them one by one.
1. Rising Wedge Pattern Strategy 1
Just after a trader has identified the rising wedge pattern either an uptrend or downtrend, the first strategy suggests taking a short position when the price breaks the bottom side of the wedge.
Before taking a trade, one should make sure that it is not a false breakout. One should wait for the closing of the security price to occur below the bottom trend line.
Stop-loss should be fixed at the top side of the rising wedge line. Target price should be set in the following manner. The height of the back of the wedge should be measured.
That much distance should be extended on the chart below the breakdown from the bottom trend line.
2. Rising Wedge Pattern Strategy 2
The bottom trend line can be called as a support in the chart.
According to strategy 2, one should wait for the price to trade below the resistance. A trade should be initiated after the retest of the bottom trend line. Now, the broken support can be referred to as the resistance on the chart.
Stop-loss should be fixed above the new resistance area. And to calculate the target profit, one needs to measure the height of the back of the wedge and extend it on the chart downwards from the entry point of the trade.
Rising Wedge Pattern Success Rate
Just like any strategy of earning consistent returns from markets, the success rate of rising wedge pattern in stock and currency markets cannot be 100%. There may be chances when prices start to move in the unfavourable direction due to any unforeseen reason.
Therefore, it is extremely important to enter any trade with a pre-defined stop loss to shield oneself from a capital wipeout.
Generally, in case of a rising wedge pattern, the breakout is in a downward direction.
In order to use the Rising Wedge Pattern for trading purposes, one should also pay attention to other factors like volumes figures of trade in every trading session, Relative Strength Index (RSI), etc.
If the pattern is supported by other technical indicators also, it becomes much stronger and the probability of it giving successful trades increases many times.
Rising Wedge Example
Let us take a real-life example to observe rising wedge pattern and see how a trade taken at the right moment could have earned huge profits for a trader.
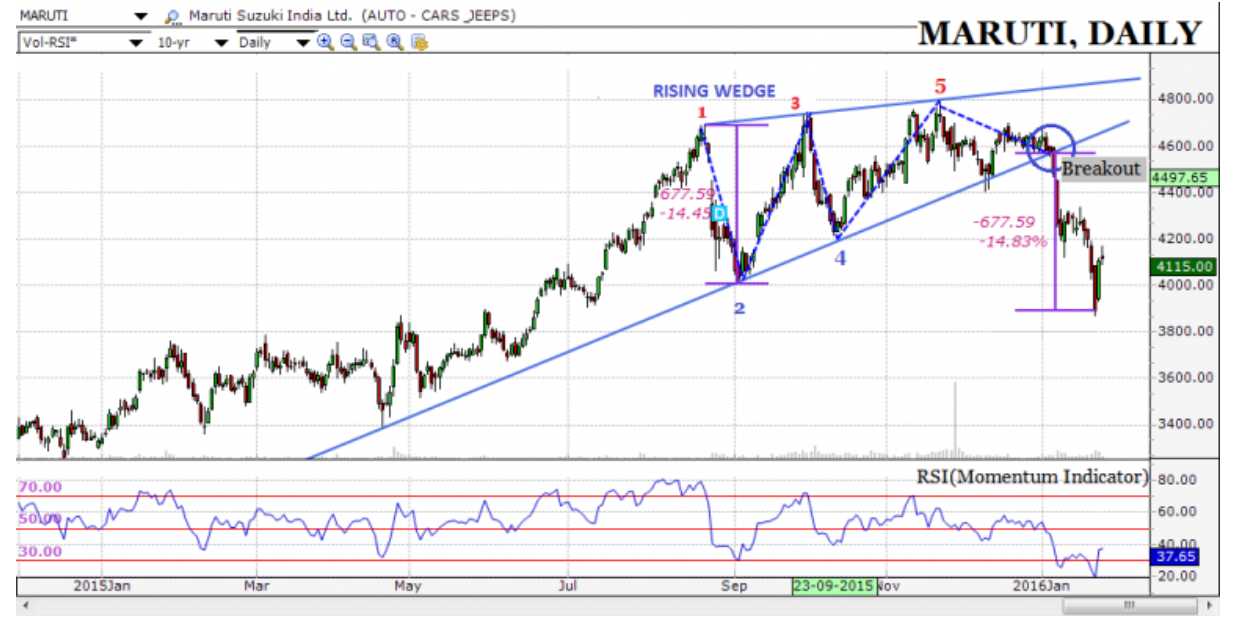
Please take a good look at the daily technical chart of Maruti Suzuki India Limited posted below:
In this chart, one can see a clear rise in prices from the month of May to the end of August. This has been followed by a period of consolidation and a rising wedge pattern can be clearly seen on the chart.
Towards the end of the wedge, one can see a clear break out happening in the downward direction. A short trade taken after the confirmation of the break out of price in the month of January of the next year could have been quite a successful trade.
Rising Wedge Pattern Screener
There are many tools available on the internet which can help in making good and accurate trading decisions.
One of the examples of such tools is stock screeners present on the internet which can screen stocks as per the needs of a trader customised by him on the basis of technical indicators and other conditions.
Some of these screeners are paid and some can be used without any costs.
In fact, some broking platforms also provide this facility of developing one’s own screeners or already existing screeners for the selection of stocks and trading opportunities in them.
In order to initiate a trade after witnessing rising wedge pattern, one can use such screeners to catch them as soon as the breakout of price has happened on the daily or weekly technical charts of stocks, indices and currencies.
Rising Wedge Pattern Conclusion
A rising wedge pattern is made from two converging trend lines when the price movements start to show higher highs and higher lows in a technical chart.
This can signify two things – the continuation of the existing trend and reversal of the trend. Opportunities to take short positions to arise in both situations.
There are three things that are required to be witnessed in order to identify a rising wedge pattern.
The first one is the presence of two converging trend lines forming the shape of a wedge.
The second one is a decline in volumes traded along the way of the formation of the wedge. And the last one is a breakout happening below the bottom trend line.
There are mainly two strategies which can be applied in order to initiate a short trade after this pattern has been observed on a technical chart of any stock, index or currency.
The first strategy is to take a short position as soon as the price breakout from the bottom trend line has happened and the closing price has reached below the bottom trend line price.
The other strategy can be applied by taking a short position after the retesting of the previously broken support happens. A pre-defined stop loss needs to maintained in both the strategies to shield oneself from unfavourable price movements in the markets, the probability of which is never 0.
The stop loss is set above the top of the wedge. On the other hand, the target profit is calculated by extending the height of the wedge downwards from the entry point of the trade on the chart.
In today’s digital era, one should be aware of all the tools available in the market like stock screeners in order to identify buying and selling opportunities.
In case you are looking to get started with stock market trading or investments in general, let us assist you in taking the next steps ahead:
More on Share Market Education
Summary
Reviewer
A Digital Blogger
Date
Broker Name
Rising Wedge Pattern
Overall Rating
